LogShark Workbook - Netstat
In this section:
- What is it?
- Glossary of Important Terms to Understand Netstat Workbook Data and Dashboards
- When to use it?
- How to use it?
What is it?
The Netstat workbook (Netstat.twbx) visualizes the netstat output collected from Tableau Server, showing which processes had bound network ports and active connections at the time the logs were captured. Unlike most other LogShark workbooks, this is a single point-in-time snapshot rather than a trend over a time range. For more information about Tableau Server ports, see Ports.
Glossary of Important Terms to Understand Netstat Workbook Data and Dashboards
- Is Tableau Server Process?: Whether a process was recognized as a known Tableau Server executable, as opposed to an OS service or third-party process that also happens to have bound ports.
- Bound Local Port Count: The number of local ports a process is bound to. Ports are a limited system resource, so a process bound to an unusually large number of ports can be worth investigating.
- TCP State (e.g. LISTENING, ESTABLISHED): The state of a given TCP connection — LISTENING means the process is waiting for incoming connections on that port, while ESTABLISHED means an active connection is open.
When to use it?
- Get a snapshot of which processes on which workers had bound network ports at the time the logs were captured.
- Identify processes that are bound to an unusually large number of ports, which can lead to port exhaustion and network communication issues.
- Look up exactly what a specific local port was bound to, or what foreign address/port a connection was established with, on a given worker.
- Distinguish Tableau Server’s own processes from other OS/third-party processes when reviewing bound ports.
How to use it?
Netstat Process Overview
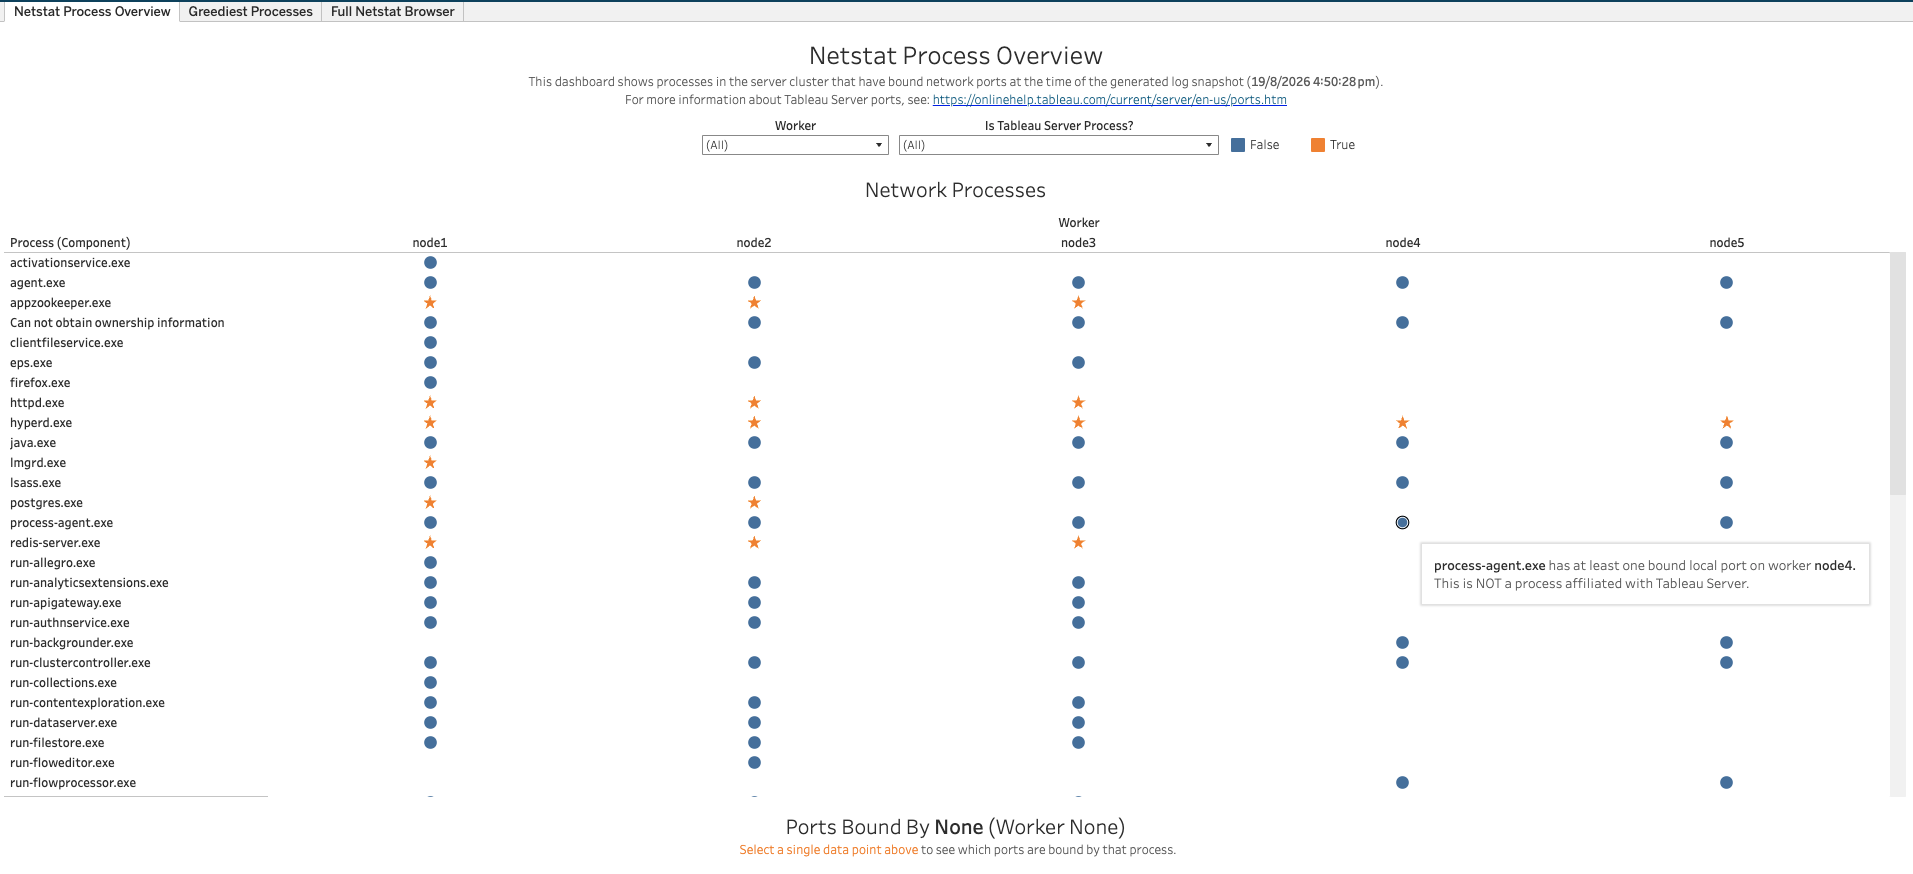
This dashboard shows processes in the server cluster that have bound network ports at the time of the generated log snapshot.
Views:
- Network Processes: A grid of every process (by Worker) that has at least one bound local port. Selecting a data point populates the “Ports Bound By” table below with that process/worker’s bound ports.
Filters:
- Worker dropdown
- Is Tableau Server Process? dropdown (True/False)
Use Cases:
- Confirm whether an unfamiliar process has bound ports on a given worker, and whether it’s a recognized Tableau Server process or not.
- Select a process/worker combination to drill into exactly which ports it has bound.
Greediest Processes
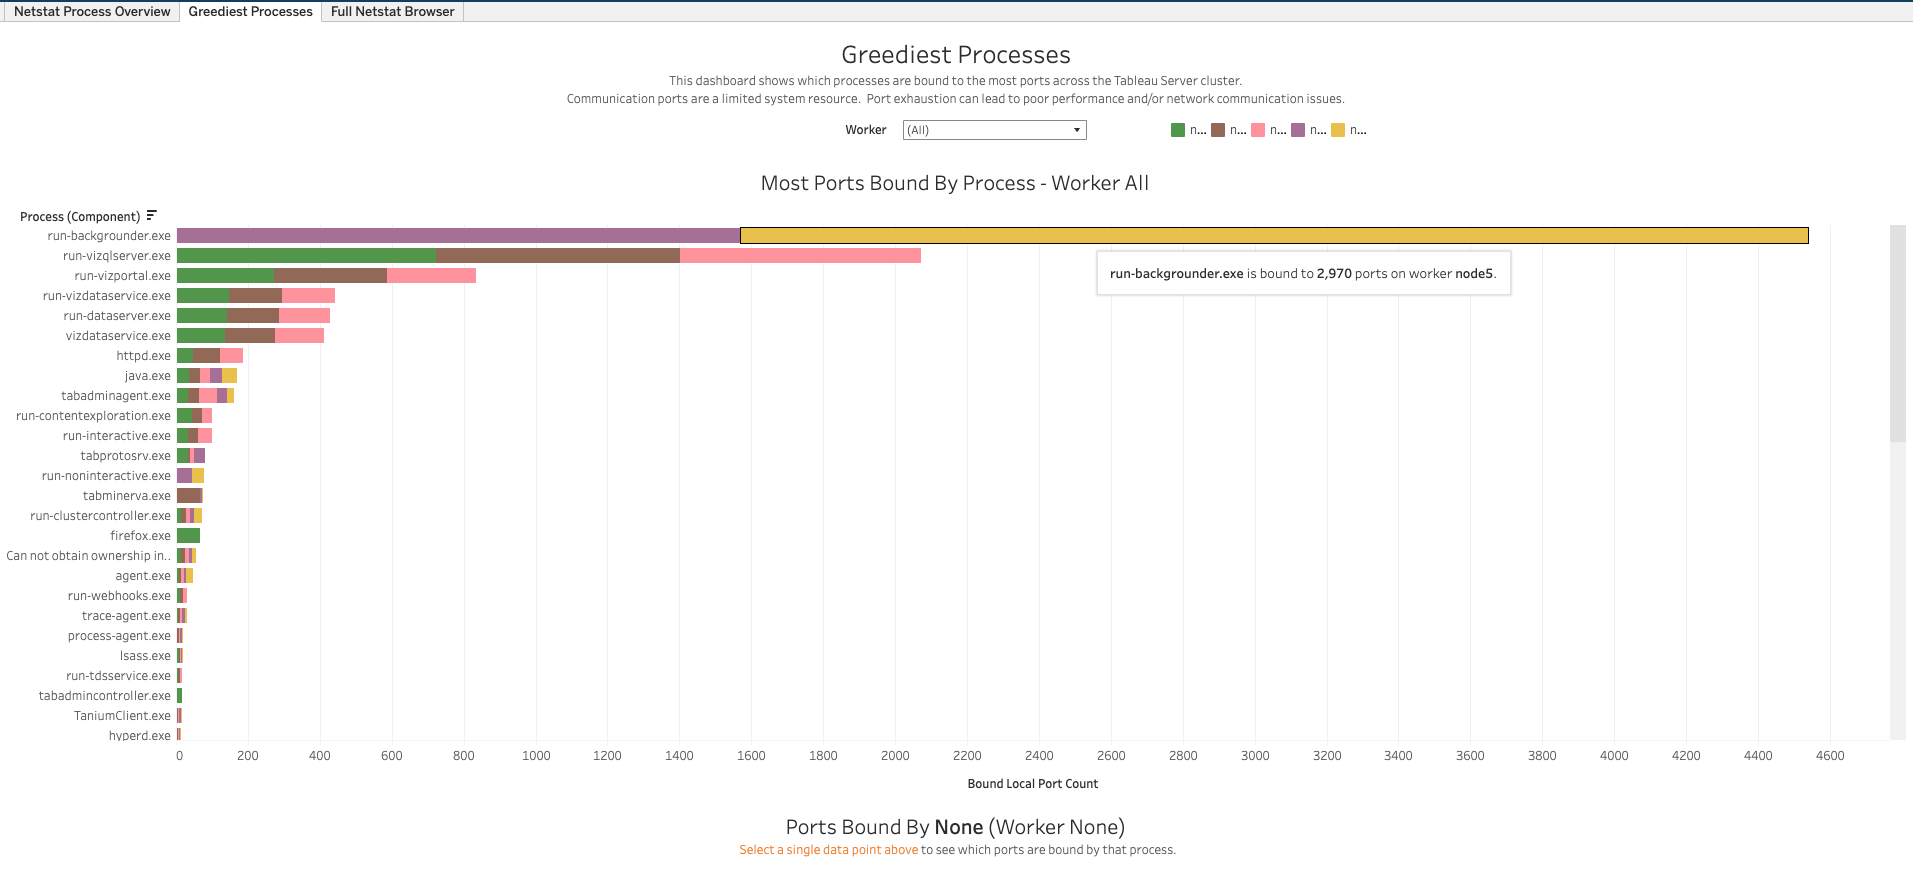
This dashboard shows which processes are bound to the most ports across the Tableau Server cluster. Communication ports are a limited system resource — port exhaustion can lead to poor performance and/or network communication issues.
Views:
- Most Ports Bound By Process: A bar chart of Bound Local Port Count by process, colored/stacked by Worker. Hovering over a segment shows the exact port count for that process/worker.
Filters:
- Worker dropdown
Use Cases:
- Identify which process is consuming the most ports across the cluster, and on which worker(s).
- Spot a process with an unexpectedly high port count that could be at risk of port exhaustion.
Full Netstat Browser
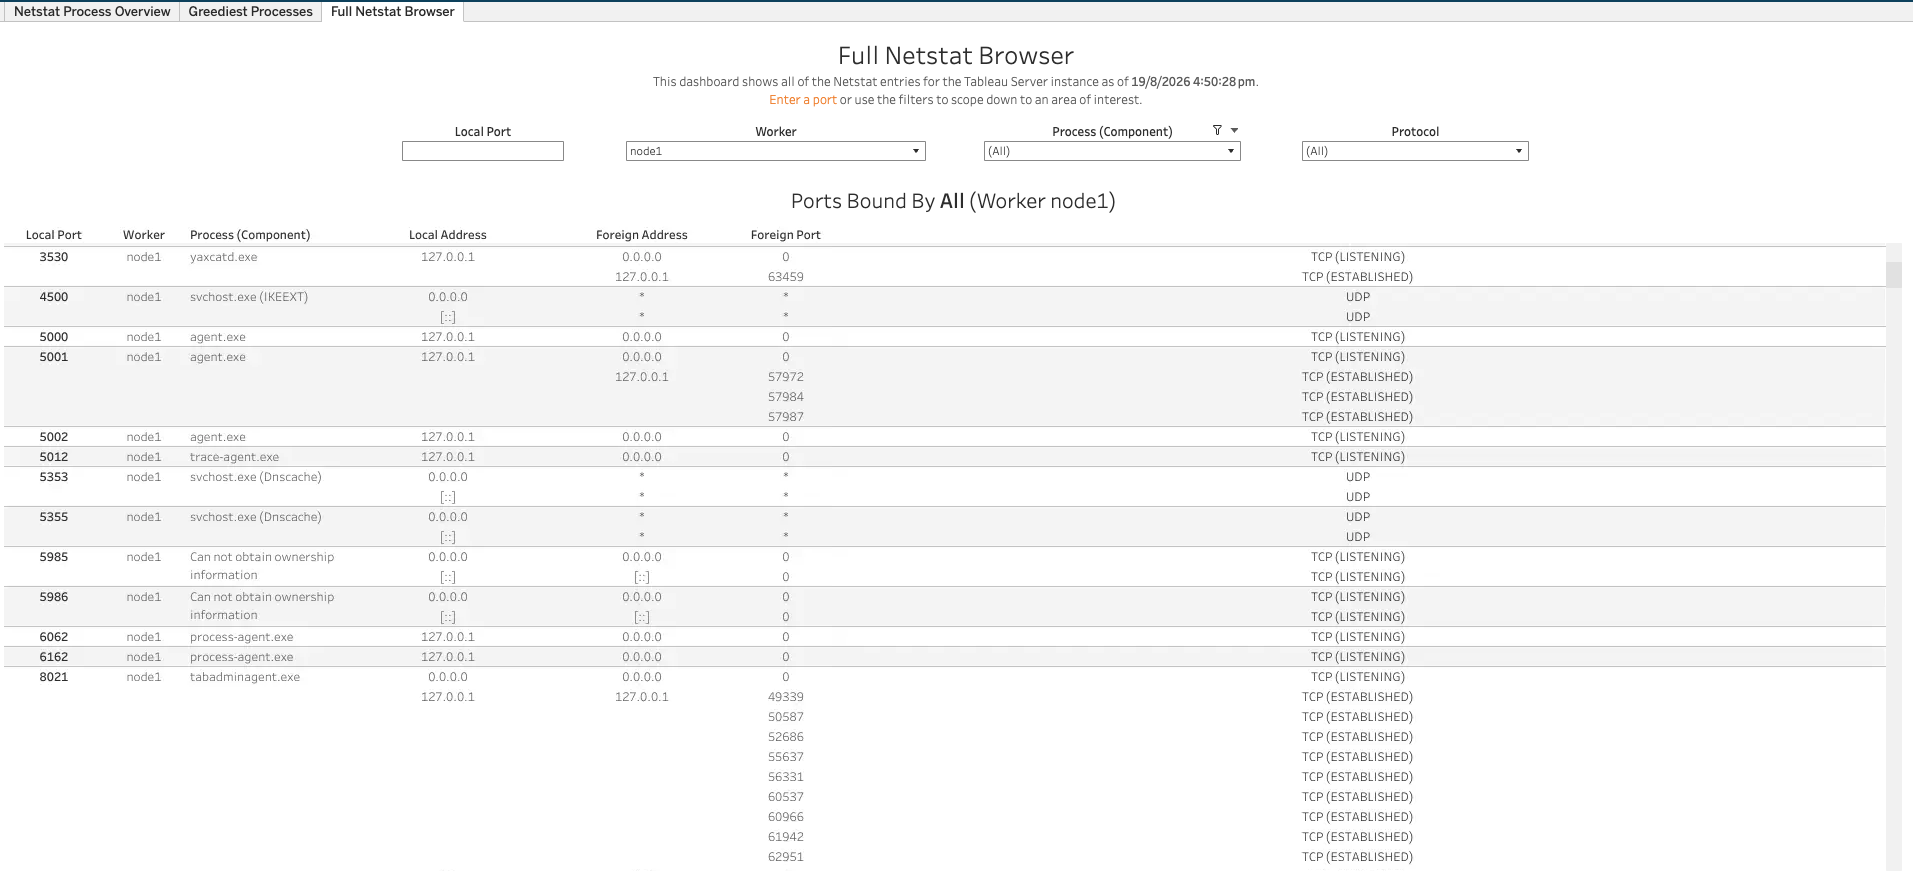
This dashboard shows all of the Netstat entries for the Tableau Server instance. Enter a port or use the filters to scope down to an area of interest.
Views:
- Ports Bound By table: A row per bound port/connection, showing Local Port, Worker, Process (Component), Local Address, Foreign Address, Foreign Port, and Protocol/TCP State.
Filters:
- Local Port search box
- Worker dropdown
- Process (Component) dropdown
- Protocol dropdown
Use Cases:
- Look up exactly which process owns a specific local port on a specific worker.
- Investigate active (ESTABLISHED) connections to/from a given process to see what it’s communicating with.