LogShark Workbook - ClusterController
In this section:
- What is it?
- Glossary of Important Terms to Understand ClusterController Workbook Data and Dashboards
- When to use it?
- How to use it?
What is it?
The ClusterController workbook (ClusterController.twbx) visualizes logs from Tableau Server’s Cluster Controller process and the Zookeeper coordination service it depends on. It surfaces ERROR/FATAL events logged by both Cluster Controller and Zookeeper, Zookeeper’s disk-sync (fsync) latency, Cluster Controller’s disk I/O and disk space monitoring, and the start/stop/restart/failover commands Cluster Controller issued to the Postgres repository process.
Glossary of Important Terms to Understand ClusterController Workbook Data and Dashboards
- Fsync Latency: How long it took Zookeeper to flush (fsync) its in-memory state to the filesystem. This is only logged when it takes longer than 1 second, and high values can lead to cluster failover events.
- Disk Queue Length: The max disk queue length recorded in a given minute for a device. A high value usually indicates a disk I/O bottleneck.
- Postgres Command: A start, stop, restart, or failover command that Cluster Controller issued to the Postgres repository process on a worker.
- Message Bin: A normalized/grouped version of an error message, used to roll up many similar raw log lines into a single row for counting.
When to use it?
- Check whether Cluster Controller or Zookeeper logged any ERROR/FATAL events on a given worker or time range, and inspect the raw error messages.
- Check whether Zookeeper’s fsync latency has spiked above 1 second, which can be an early indicator of disk I/O problems that lead to a cluster failover.
- Investigate disk I/O and disk space trends (queue length, used vs. total space per device) to diagnose a disk bottleneck.
- Confirm exactly when Cluster Controller started, stopped, restarted, or failed over the Postgres repository process, and on which worker.
How to use it?
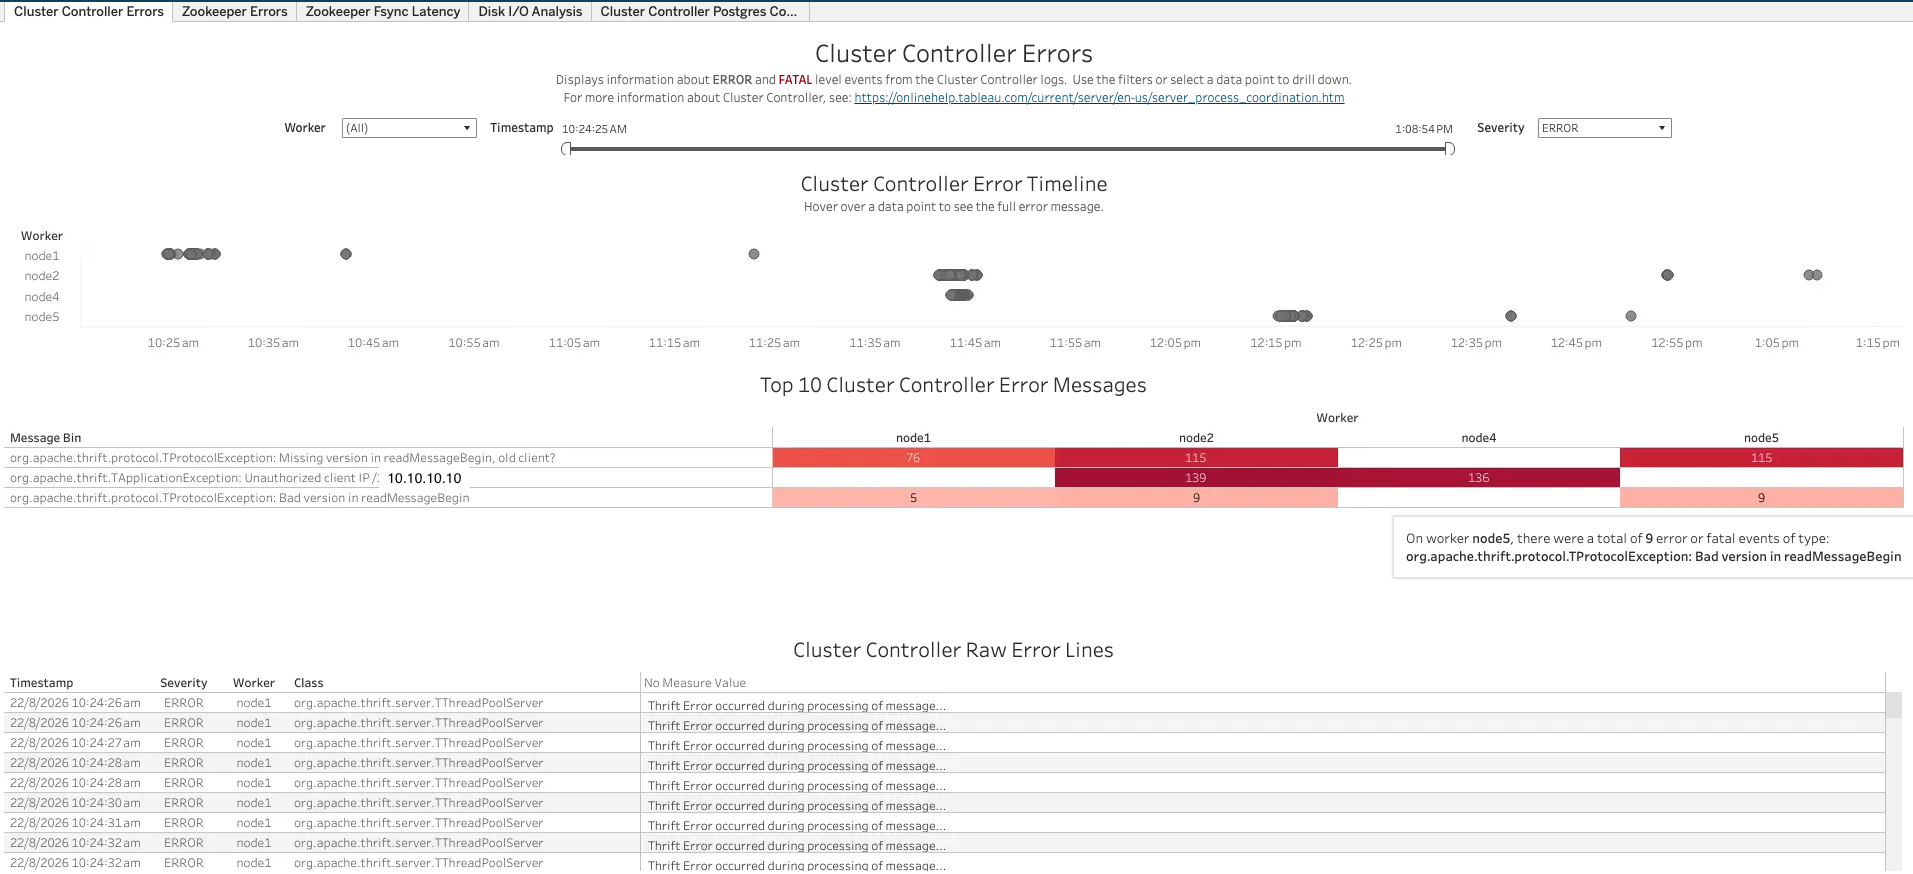
Cluster Controller Errors
Displays information about ERROR and FATAL level events from the Cluster Controller logs. Use the filters or select a data point to drill down.
Views:
- Cluster Controller Error Timeline: A scatter plot of ERROR/FATAL events by Worker over time. Hovering over a data point shows the full error message.
- Top 10 Cluster Controller Error Messages: A breakdown of the most common error messages (grouped into Message Bins), by Worker, with the count of occurrences.
- Cluster Controller Raw Error Lines: A table of raw error rows — Timestamp, Severity, Worker, Class, and Message — matching the current filters.
Filters:
- Worker dropdown
- Timestamp range filter
- Severity dropdown
Use Cases:
- Get a quick sense of which workers are logging the most Cluster Controller errors, and what the most common error messages are.
- Drill into the raw error lines for full detail on a specific error.
Zookeeper Errors
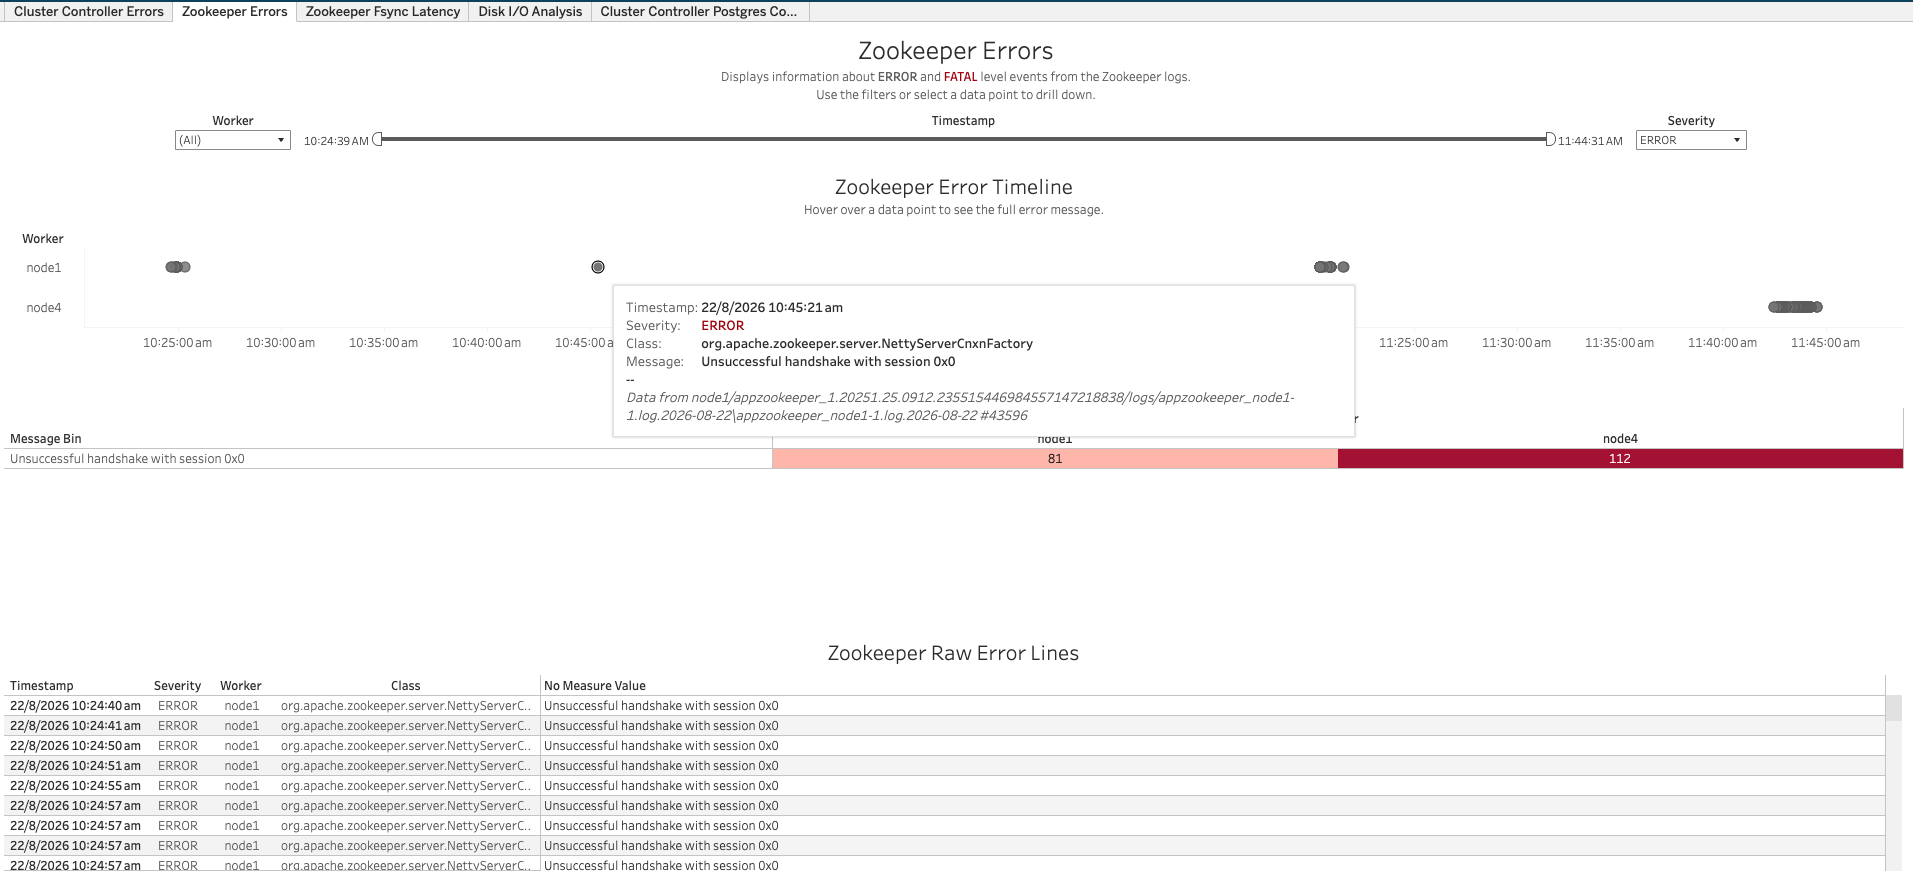
Displays information about ERROR and FATAL level events from the Zookeeper logs. Use the filters or select a data point to drill down.
Views:
- Zookeeper Error Timeline: A scatter plot of ERROR/FATAL events by Worker over time. Hovering over a data point shows the timestamp, severity, class, and full error message.
- Message Bin table: A breakdown of the most common error messages, by Worker, with the count of occurrences.
- Zookeeper Raw Error Lines: A table of raw error rows — Timestamp, Severity, Worker, Class, and Message — matching the current filters.
Filters:
- Worker dropdown
- Timestamp range filter
- Severity dropdown
Use Cases:
- Get a quick sense of which workers are logging the most Zookeeper errors, and what the most common error messages are.
- Drill into the raw error lines for full detail on a specific error.
Zookeeper Fsync Latency
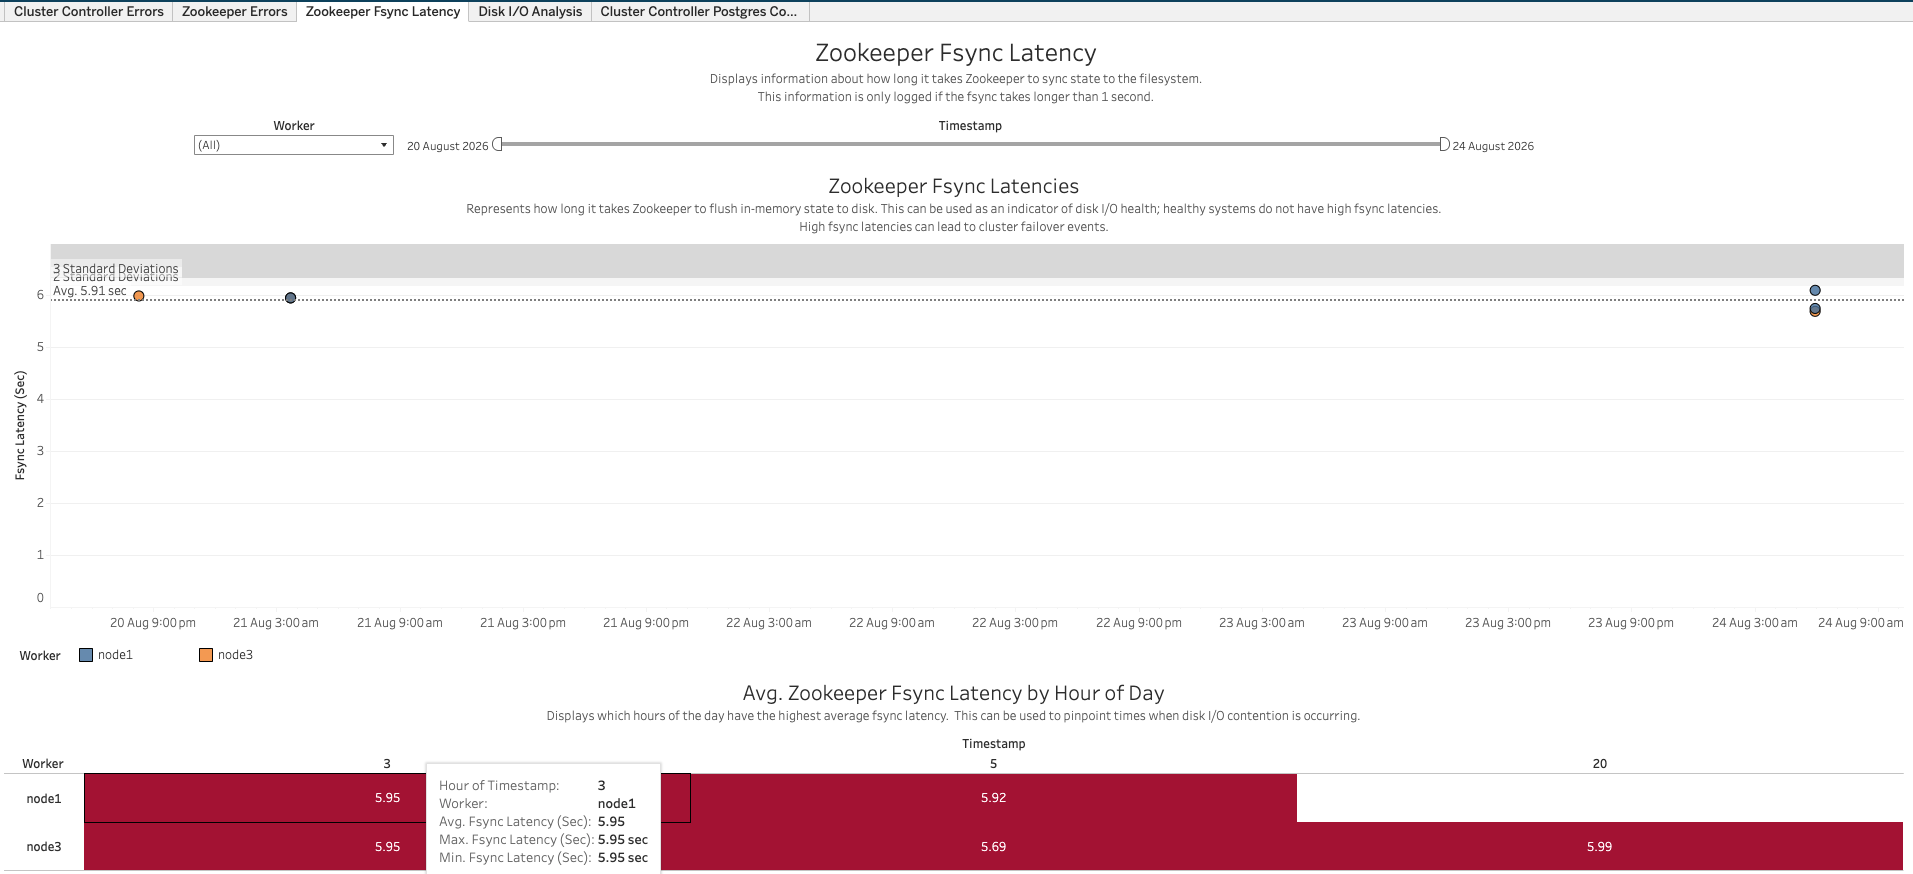
Displays information about how long it takes Zookeeper to sync state to the filesystem. This information is only logged if the fsync takes longer than 1 second.
Views:
- Zookeeper Fsync Latencies: A scatter plot of fsync latency (seconds) over time, colored by Worker, with 2/3-standard-deviation reference bands. Represents how long it takes Zookeeper to flush in-memory state to disk — this can be used as an indicator of disk I/O health, since healthy systems do not have high fsync latencies, and high fsync latencies can lead to cluster failover events.
- Avg. Zookeeper Fsync Latency by Hour of Day: A table of average fsync latency by Worker for each hour of the day (with max/min available on hover), to help pinpoint times when disk I/O contention is occurring.
Filters:
- Worker dropdown
- Timestamp range filter
Use Cases:
- Determine whether Zookeeper’s fsync latency is elevated — since it’s only logged at all once it exceeds 1 second — as an early warning sign of disk I/O problems that could trigger a cluster failover.
- Pinpoint which hour(s) of the day disk I/O contention tends to occur.
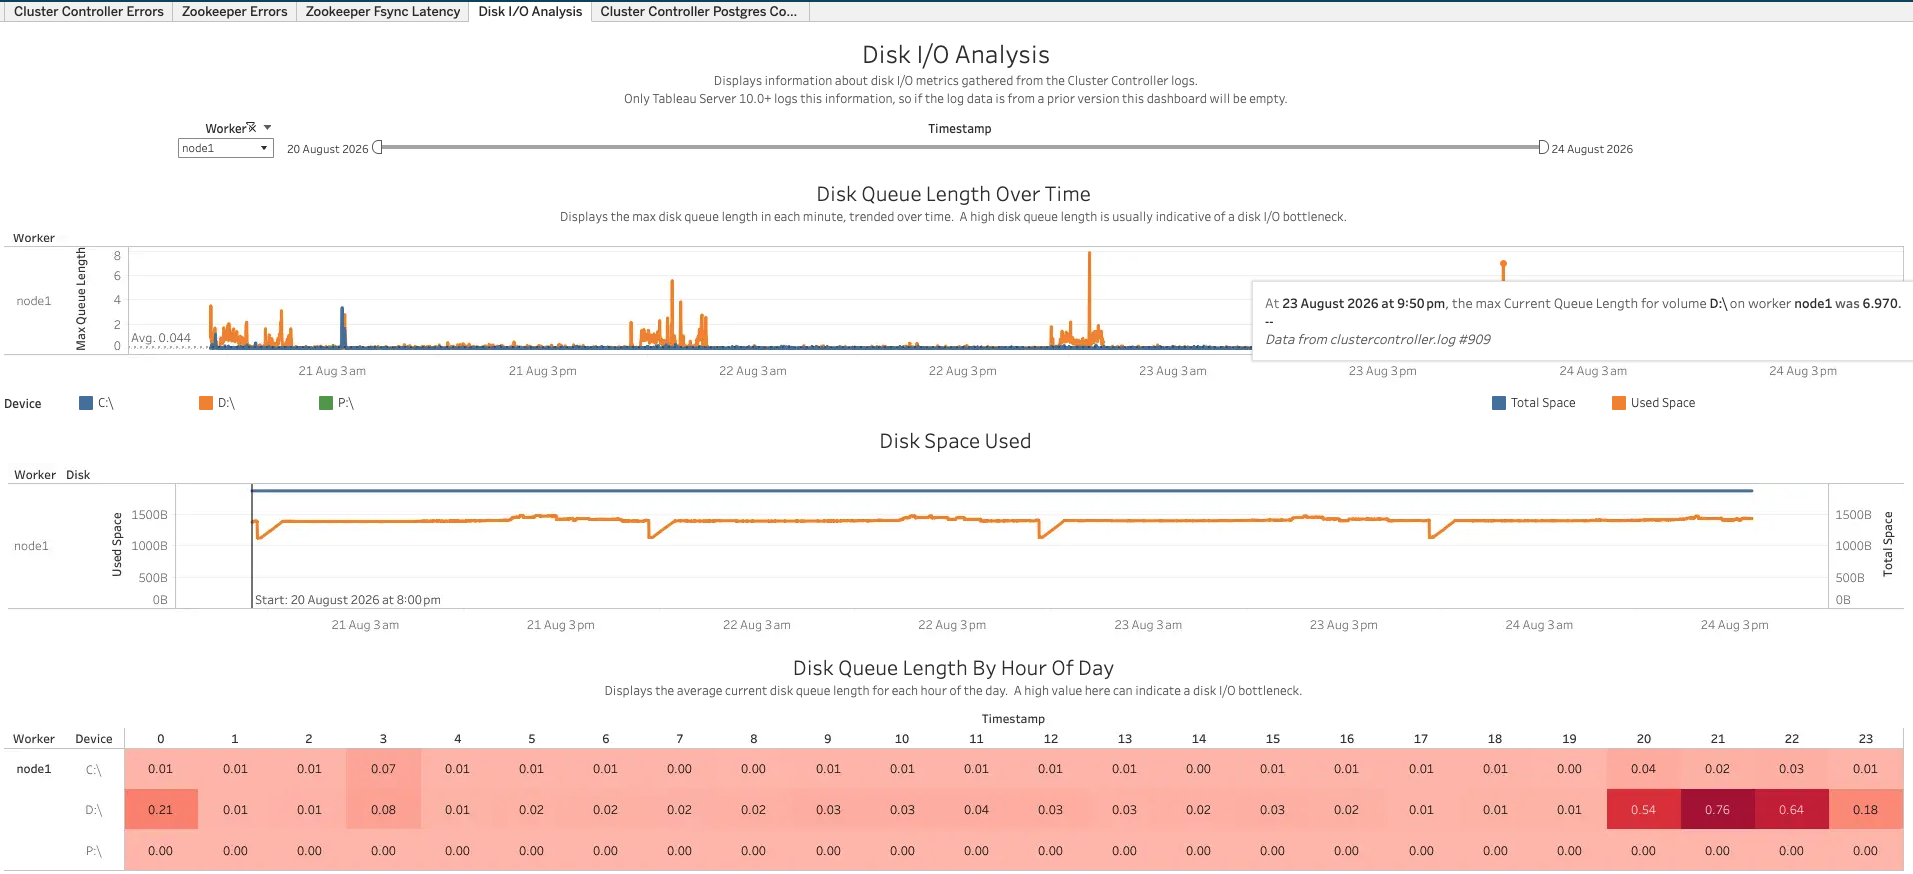
Disk I/O Analysis
Displays information about disk I/O metrics gathered from the Cluster Controller logs.
Views:
- Disk Queue Length Over Time: The max disk queue length in each minute, trended over time by Worker and Device. A high disk queue length is usually indicative of a disk I/O bottleneck. Hovering over a point shows the exact queue length value and the source log line it came from.
- Disk Space Used: Used space vs. total space per disk/device per Worker, trended over time.
- Disk Queue Length By Hour Of Day: The average current disk queue length for each hour of the day, by Worker and Device. A high value here can indicate a disk I/O bottleneck.
Filters:
- Worker dropdown
- Timestamp range filter
Use Cases:
- Confirm whether disk queue length or used space trended abnormally on a given device/worker, which can point to a disk I/O bottleneck.
- Cross-reference against the Zookeeper Fsync Latency dashboard, since both point at the same underlying disk I/O health.
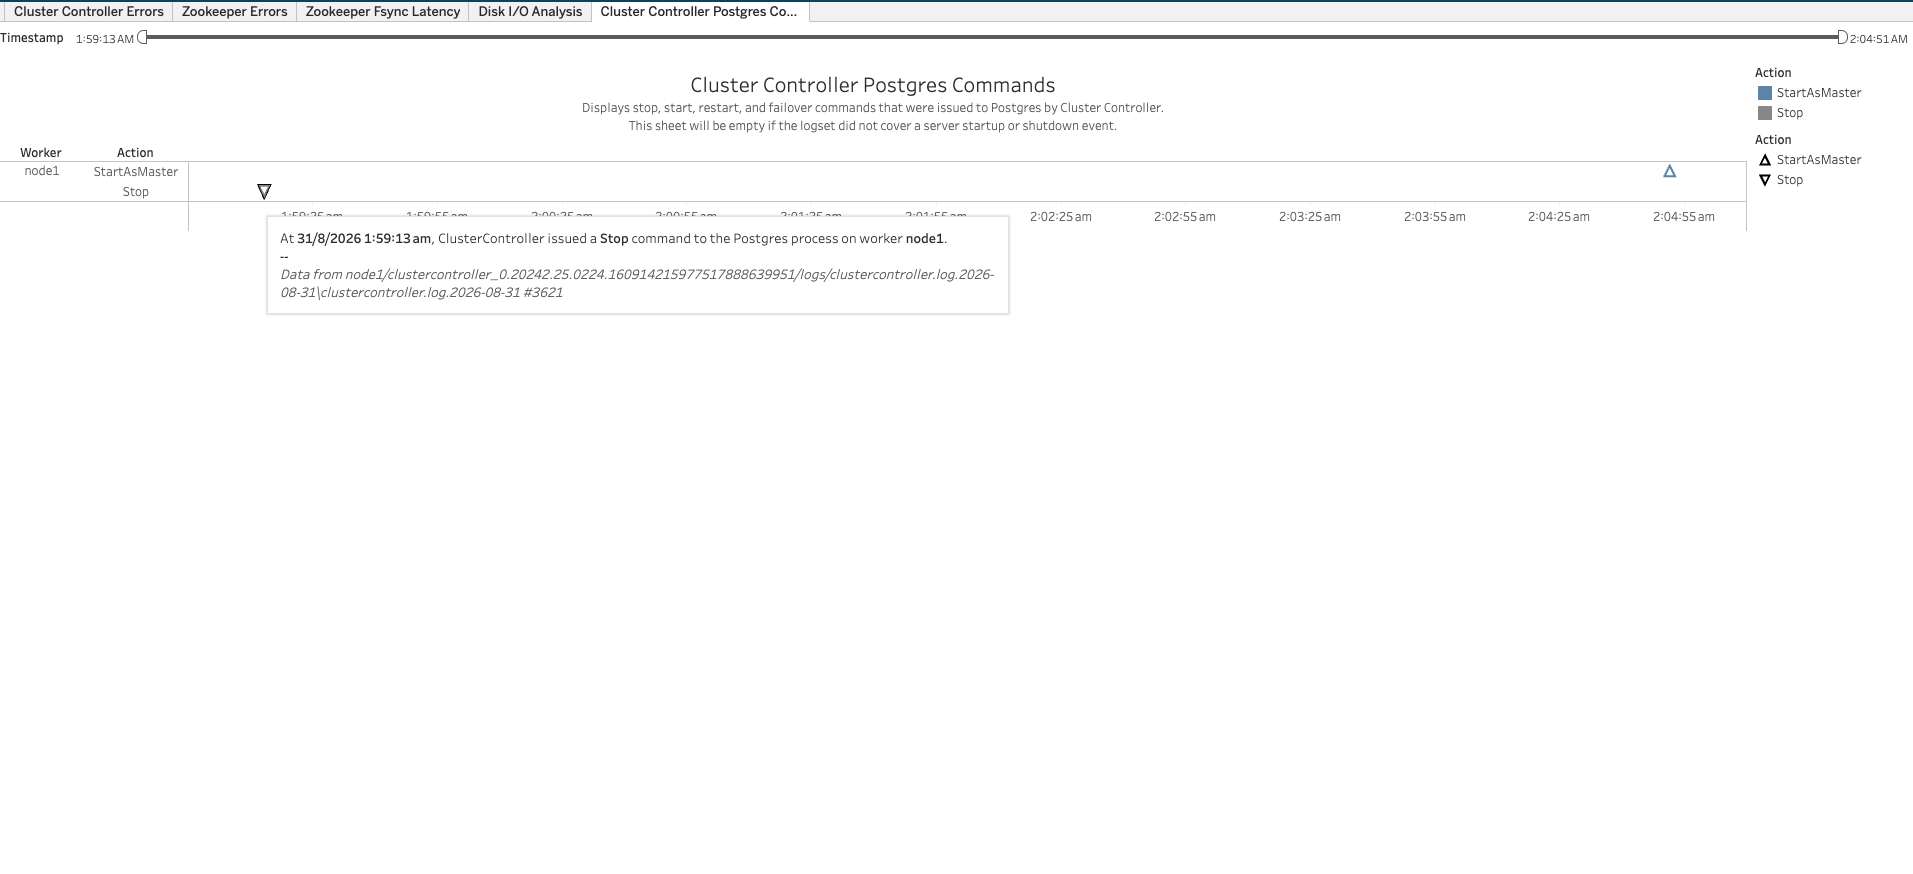
Cluster Controller Postgres Commands
Displays stop, start, restart, and failover commands that were issued to Postgres by Cluster Controller. This sheet will be empty if the logset did not cover a server startup or shutdown event.
Views:
- Postgres Command Timeline: A plot of every start/stop/restart/failover command issued to the Postgres process, by Worker, over time. Hovering over a mark shows the worker, the exact command issued, the timestamp, and the source log line it came from.
Filters:
- Timestamp range filter
Use Cases:
- Confirm exactly when, and on which worker, Cluster Controller started, stopped, restarted, or failed over the Postgres repository process — useful when investigating a server startup/shutdown or an unexpected Postgres failover.
- Keep in mind this dashboard will be empty unless the logset spans a server startup or shutdown event.