WDC Tutorial
Deprecated: This repository will be removed with the Tableau 26.3 release.
The Web Data Connector 2.x framework is deprecated. Migrate to the REST API Connector on Tableau Exchange — built by Tableau, supports JSON and CSV over HTTP GET, Basic/Bearer/OAuth authentication, and runs on Tableau 2023.3 and later. Note: this connector is extract-only and requires a JDBC driver installation.
This tutorial picks up where the Get Started topic left off. If you haven’t already, go back and set up your development environment.
By the end of this tutorial, you’ll have a working WDC that connects to the USGS Earthquake feed and downloads data for earthquakes that occurred in the last week.
You’ll learn how to:
- Create the HTML page
- Create the connector object
- Add an event listener
- Test the connector so far
- Define a schema
- Get the data
- See it in action
If you really want to skip all of this and go straight to the source code, look for the earthquakeUSGS files in the
Examples directory. You’ll get a lot more out of this if you build it from scratch though–promise!
Note: The connector that we’ll create in this tutorial (earthquakeWDC) has a different name than the same
connector in the Examples directory (earthquakeUSGS). This is to minimize the chances of accidentally overwriting
the existing sample. However, if you copy the existing sample, you’ll have to change file paths.
Note: The browser used inside Tableau Desktop 2019.3 and earlier is QT WebKit, which does not natively support new ES6 features. If you wish to take advantage of newer features (such as promises) when building WDCs for older versions of Tableau you will need to use a polyfill.
Create the HTML page
When you open a WDC in Tableau, you display an HTML page that links to your JavaScript code and to the WDC library. Optionally, this page can also display a user interface for your users to select the data that they want to download.
Create a new file named earthquakeWDC.html and save it in the top-level directory of the webdataconnector
repository. (This is the same directory as the README.)
Then, copy the following code into the file:
<html>

<head>
    <title>USGS Earthquake Feed</title>
    <meta http-equiv="Cache-Control" content="no-store" />

    <link href="https://maxcdn.bootstrapcdn.com/bootstrap/3.3.6/css/bootstrap.min.css" rel="stylesheet" crossorigin="anonymous">
    <script src="https://ajax.googleapis.com/ajax/libs/jquery/1.11.1/jquery.min.js" type="text/javascript"></script>
    <script src="https://maxcdn.bootstrapcdn.com/bootstrap/3.3.6/js/bootstrap.min.js" crossorigin="anonymous"></script>

    <script src="https://connectors.tableau.com/libs/tableauwdc-2.3.latest.js" type="text/javascript"></script>
    <script src="earthquakeWDC.js" type="text/javascript"></script>
</head>

<body>
    <div class="container container-table">
        <div class="row vertical-center-row">
            <div class="text-center col-md-4 col-md-offset-4">
                <button type="button" id="submitButton" class="btn btn-success" style="margin: 10px;">Get Earthquake Data!</button>
            </div>
        </div>
    </div>
</body>

</html>
Let’s run through what the code is doing. Skipping over the standard markup for an HTML page, you’ll notice the
following between the head tags:
- The
metatag prevents your browser from caching the page. - The
bootstrap.min.cssandbootstrap.min.jsfiles are used to simplify styling and formatting. - The
jquery.min.jsfile will be used as a helper library by our connector. (For example, the connector uses jQuery to get JSON data.) - The
tableauwdc-2.3.latest.jsfile is the main library for the WDC API. - The
earthquakeWDC.jsfile is the (not yet created) JavaScript code for our connector.
Between the body tags, there is a simple button element that illustrates how users can interact with your connector
before getting data. In a later step, you’ll attach an event listener to the button in the JavaScript code.
Create the connector object
Now that you’ve created a user interface, it’s time to write the JavaScript code for the connector. Create a new file
named earthquakeWDC.js and save it in the same directory as the earthquakeWDC.html file.
Copy the following code into the file to create the basic structure of the connector:
(function () {
    var myConnector = tableau.makeConnector();

    myConnector.getSchema = function (schemaCallback) {

    };

    myConnector.getData = function (table, doneCallback) {

    };

    tableau.registerConnector(myConnector);
})();
Some things to note about the code:
- The code is wrapped in an immediately invoked function expression to create a local scope.
- The
tableauobject isn’t defined in our code, but in the WDC library. (It’s assigned to the global scope.) - The
makeConnectorfunction is a constructor that predefines some methods for our connector object. - The
getSchemaandgetDatafunctions are placeholders for now, but will contain the logic for getting the table schema of the data and downloading the data. - The
registerConnectorfunction validates the connector object before initialization.
Add an event listener
Remember how we added a button to the HTML page? It’s time to create an event listener that responds to clicking on the button.
Copy the following code and paste it directly below the registerConnector function:
$(document).ready(function () {
    $("#submitButton").click(function () {
        tableau.connectionName = "USGS Earthquake Feed";
        tableau.submit();
    });
});
Here’s what is going on in the code snippet:
- The jQuery
$(document).readyfunction runs some code when the page loads. - An click event listener is added to the button element created earlier. The button is identified by the
submitButtonid. - The
tableau.connectionNamevariable defines what we want to call the connector data source when it is displayed in Tableau. - The
tableau.submit()function sends the connector object to Tableau for validation.
Tip: Not every connector needs a user interface. If you want a connector to run without user input, you can use custom initialization code. For more information, see Custom Initialization and Shutdown
Test the connector so far
The connector doesn’t do very much so far, but it’s enough that we can run it in the simulator.
Note: Have you followed the steps in the Getting Started topic to set up the simulator? This section assumes that you’ve installed dependencies already.
-
Open a command prompt or terminal in the top-level directory for the
webdataconnectorrepository. -
Run
npm startto run the test server. -
Open a browser and navigate to the following URL:
http://localhost:8888/Simulator/index.html -
In the WDC URL field, enter the path to your WDC relative to the simulator. For example, if you created your WDC in the top-level directory, you might enter:
../earthquakeWDC.html -
Click the Start Interactive Phase button. The connector page appears in a new window.
-
Click Get Earthquake Data!. The connector page closes.
At this point, you might be thinking “Well…did it work?” Let’s add a log message so that you can practice debugging the connector.
Add a log message to confirm it is working (sort of)
-
In the
earthquakeWDC.jsfile, copy the following code and replace the emptymyConnector.getSchemafunction:myConnector.getSchema = function (schemaCallback) { tableau.log("Hello WDC!"); };The
tableau.logfunction allows you to pass messages from your connector back to the simulator. These log messages are then printed with the browser’s built-inconsole.log()function on the simulator page. - Refresh the simulator page in your browser.
- Open your browser’s developer tools. For example, in Chrome you can press Ctrl+Shift+I.
- Click Start Interactive Phase.
- Click Get Earthquake Data!.
If all goes well, you should see Hello WDC! in your browser’s console.
Define a schema
So the connector is working now–sort of. Before you can download data and pass it to Tableau, you need to define how you want to map the data to one or more or tables. This mapping of data is done in the schema.
To decide what data you want to map in the schema, you can take a look at the USGS description of the JSON data source: GeoJSON Summary Format. Rather than map all the data available from the data source, this example has selected a focused subset.
When you’re done looking at the summary of the JSON data source, copy the following code into the earthquakeWDC.js
file and replace the placeholder getSchema function:
myConnector.getSchema = function (schemaCallback) {
    var cols = [{
        id: "id",
        dataType: tableau.dataTypeEnum.string
    }, {
        id: "mag",
        alias: "magnitude",
        dataType: tableau.dataTypeEnum.float
    }, {
        id: "title",
        alias: "title",
        dataType: tableau.dataTypeEnum.string
    }, {
        id: "location",
        dataType: tableau.dataTypeEnum.geometry
    }];

    var tableSchema = {
        id: "earthquakeFeed",
        alias: "Earthquakes with magnitude greater than 4.5 in the last seven days",
        columns: cols
    };

    schemaCallback([tableSchema]);
};
Here’s what’s going on in the code:
- The
getSchemafunction takes aschemaCallbackparameter which is defined by the WDC API. - The
colsvariable contains an array of JavaScript objects, where each object defines a single column in our table. In this example, there are columns for magnitude, title, and location. Note that for each column you can specify additional options. For example, the alias defines a friendly name that can appear in Tableau and the columnRole determines whether a field is a measure or a dimension. Theidcan only contain alphanumeric values (a-z, A-Z, 0-9) and underscore characters (_). The identifiers cannot contain spaces, hyphens, or special characters. For more options, see the API reference. - The
tableSchemavariable defines the schema for a single table and contains a JavaScript object. Here, the value of thecolumnsproperty is set to thecolsarray defined earlier. - The
schemaCallbackgets called when the schema is defined. TheschemaCallbacktakes an array of table objects. In this case, there is only table object (thetableSchemaobject defined above).
Note: The API Reference describes the properties that you can define for the table object and for each object in the table columns in more detail. For now, let’s plunge ahead to the exciting part–getting the data!
Get the data
Once the schema is defined, you can begin getting data and passing it to Tableau.
Copy the following code and replace the placeholder getData function:
myConnector.getData = function(table, doneCallback) {
    $.getJSON("https://earthquake.usgs.gov/earthquakes/feed/v1.0/summary/4.5_week.geojson", function(resp) {
        var feat = resp.features,
            tableData = [];

        // Iterate over the JSON object
        for (var i = 0, len = feat.length; i < len; i++) {
            tableData.push({
                "id": feat[i].id,
                "mag": feat[i].properties.mag,
                "title": feat[i].properties.title,
                "location": feat[i].geometry
            });
        }

        table.appendRows(tableData);
        doneCallback();
    });
};
Whew! That’s a good-sized chunk of code. Let’s see what’s happening:
- The
getDatafunction takes two parameters:tableanddoneCallback. Thetableparameter is an object defined by the WDC to which you can append data. ThedoneCallbacksignals to Tableau that you are done getting data. - The jQuery
$.getJSONfunction gets earthquake data from the USGS earthquake feed and uses a success handler to store the returned data in a response parameter (resp). (You can open the URL in a browser to see what the JSON data looks like.) - The
forloop iterates over the features in the JSON object and stores the data that we want in thetableDataarray. - The
table.appendRowsfunction appends thetableDataarray to thetableas a JavaScript object.
See it in action
By now, you’re a pro at running the simulator, so fire it up,
load your connector, and click Get Earthquake Data! like before. Now that we have a getSchema function properly
defined, you should see the schema displayed in the simulator.
The moment you’ve been waiting for is here! Click Fetch Table Data to run your getData function and display the results in a table.
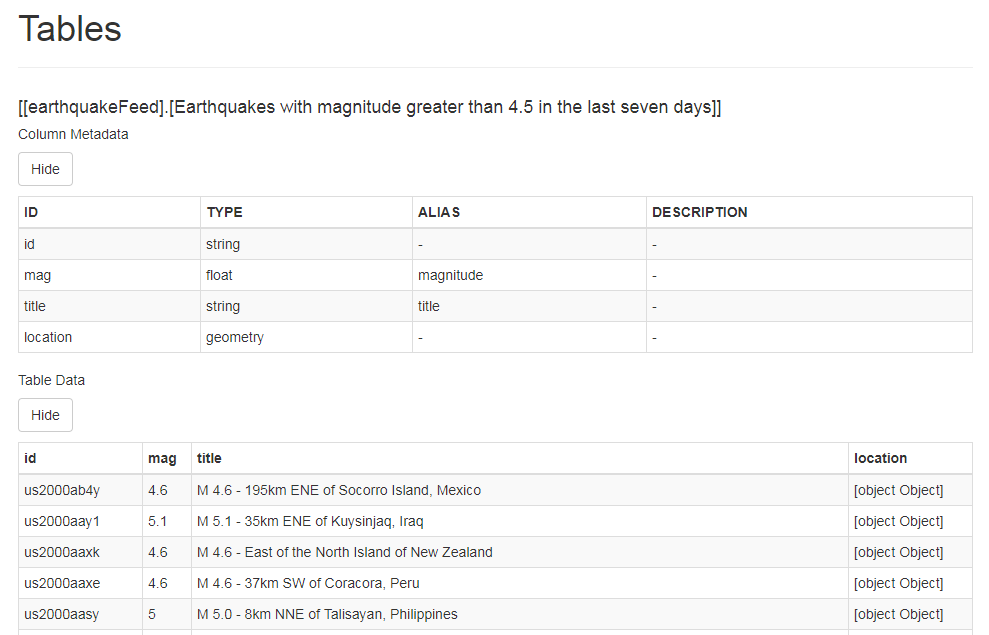
Note The location information for an earthquake is returned as a JSON object, which is why you might see
object Objectdisplayed in the simulator. Tableau 10.4 added support for geoJSON data, so while the simulator only knows you have some kind of JSON object, Tableau will have no trouble parsing the coordinates from the geometry data.
To really see things working, open your connector in Tableau:
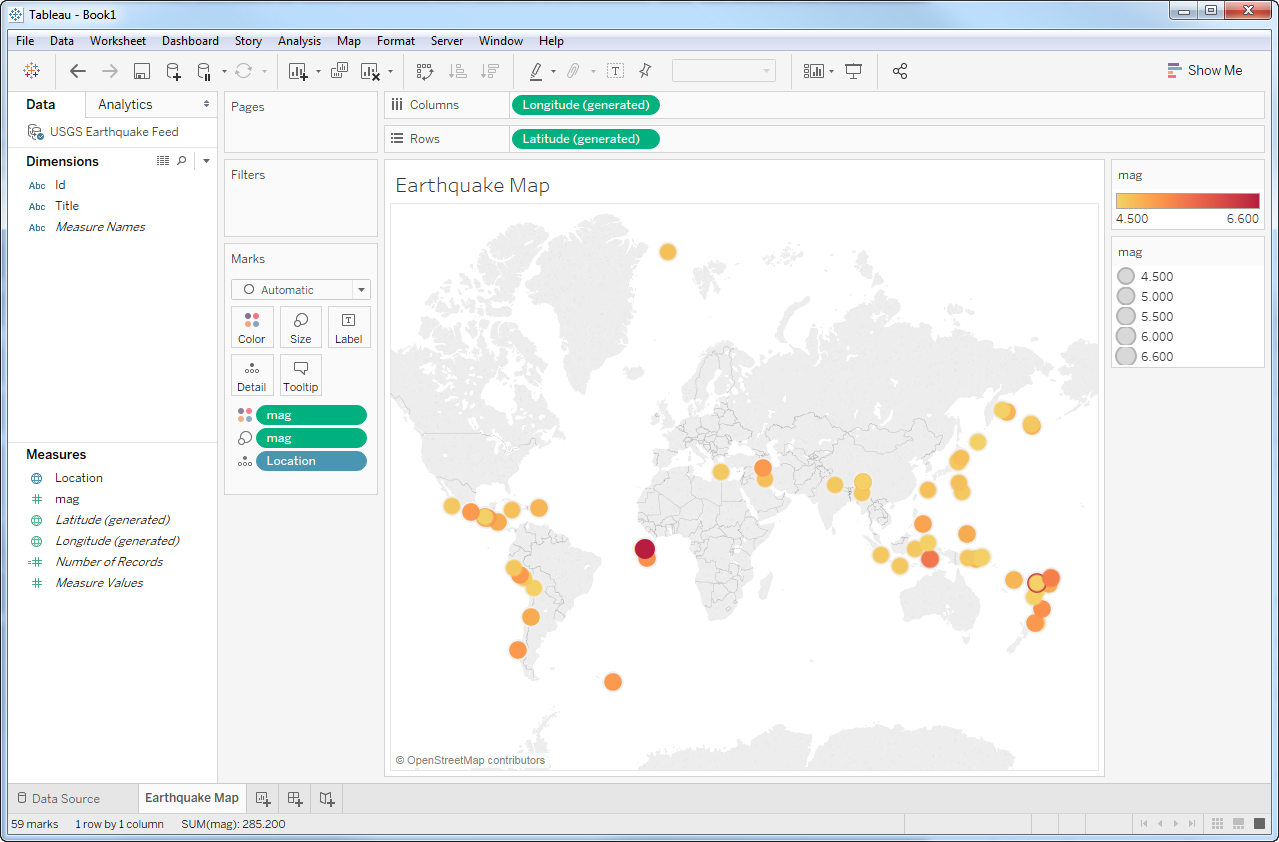
You did it! Nice work. But this is no time to rest on your laurels–try your connector in Tableau,
dig into the Examples directory to see more connectors, or read through the WDC documentation. You might want to start by
learning about connectors with multiple tables,
incremental refresh, and authentication. See the WDC Multiple Table Tutorial and WDC Node.js Proxy with OAuth Tutorial.
Better yet, dive right in and create your own connector!