Use Log files to Troubleshoot Dashboard Extensions
You can use the Tableau Desktop and Tableau Server log files to troubleshoot issues with your dashboard extension. The log files can help you identify and fix registration errors, and can help you track extension activity. You can use any text viewer, or tools like the Tableau Log Viewer, to filter the log files, so you can focus in on the activities of concern.
Support for extensions is built-in to Tableau, so there is nothing you need to set up and no code you need to add to view extension activity in Tableau log files.
In this section
- Locate the Tableau log files
- Download and install the Tableau Log Viewer
- Find dashboard extension events
- Troubleshooting errors that occur during registration
- Track extension activity
- List of extension events
Locate the Tableau log files
By default, the Tableau Desktop log file (log.txt) is are stored in the following location:
Users/<username>/Documents/My Tableau Repository
The log.txt file contains information about dashboard extension registration and information about extension command execution.
Download and install the Tableau Log Viewer
The Tableau Log Viewer is an open source tool that makes it easier to read Tableau log files. You can install the Log Viewer by downloading a .zip file for either Windows or MacOS. If you want to build the Tableau Log Viewer yourself, you can also download or clone the Log Viewer repository.
-
Download the latest release in the Releases Section of the Tableau Log Viewer repository on GitHub.
- Extract
.zipfile on your local computer. Launch the Log Viewer application (Log Viewer.exeon Windows, orLog Viewer.appon MacOS). - Open the log file from the File menu, or drag and drop the Tableau log file into the Log Viewer window.
The Tableau Log Viewer supports both Tableau Desktop and (most) Tableau Server log files. For more information, see the wiki pages on GitHub for Tableau Log Viewer.
Find dashboard extension events
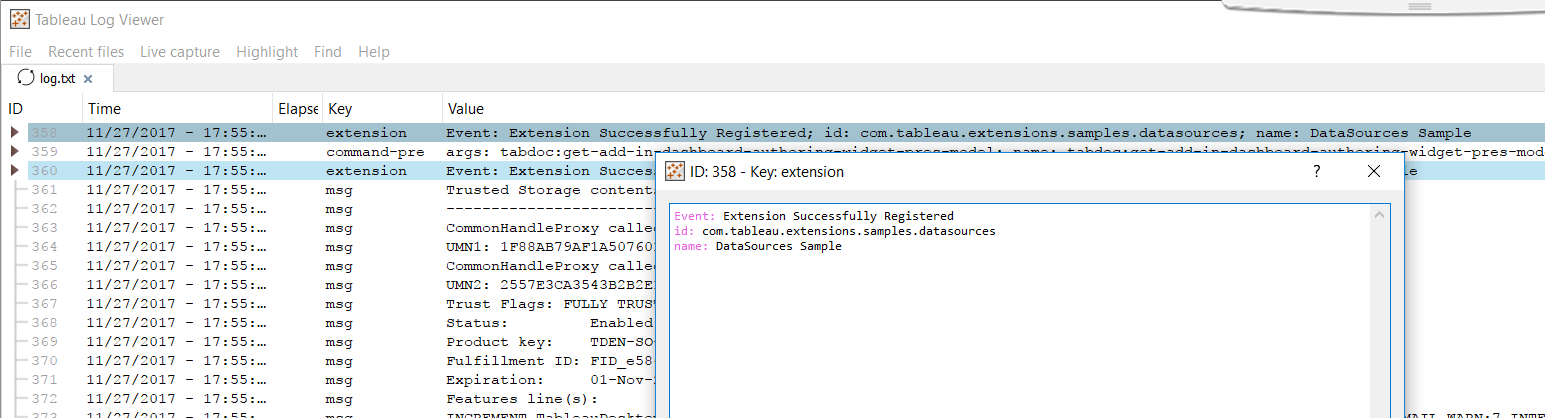
The Desktop Tableau log file (log.txt) is a JSON formatted file. The extensions activity is tagged with the key-value pair "k":"extension". You can search the log for extension. For example, this entry shows successful registration.
{"ts":"2017-11-27T17:55:55.665",
 pid":12100,"tid":"3d08","sev":"info","req":"-",
 "sess":"-",
 "site":"{FA6345B5-D64A-4ADB-9435-12F170D9B2AB}",
 "user":"-",
 "k":"extension",
    "v":{"Event":"Extension Successfully Registered",
        "id":"com.tableau.extensions.samples.datasources",
        "name":"DataSources Sample"}
}
Although, you can use any file viewer or text editor, the Tableau Log Viewer makes finding the events easy to view and navigate.
Troubleshooting errors that occur during registration
The extension registration process occurs during Tableau start up. This is when Tableau looks in the Extensions folder for the manifest files (.trex) files, and then parses the files to check for schema violations, or to check that there are duplicate identifiers. If the manifest file checks out, Tableau writes the event to the log file and the extension appears in the list of available extension in the dashboard.
There are two situations that can occur during the extension registration process that might cause errors.
- Duplicate extension ids
- XSD Validation errors
Duplicate extension identifers
Each dashboard extension must have a unique identifier. The identifier is specified in the manifest file.
<dashboard-extension id="com.tableau.extensions.samples.datasources" extension-version="0.7.0">
Tableau uses the extension identifier and the extension version number to register the dashboard extension. At startup, Tableau checks that there are no duplicate identifiers. If an extension is found that has the same identifier as one that is already registered, an error is logged and the extension with the duplicate identifier is not registered and does not appear in the list of available extensions.
Error: Registration Failed: Multiple Extensions With ID, com.tableau.extensions.samples.settings, Found
file: Settings.trex
id: com.tableau.extensions.samples.settings
XSD Validation errors
The extensions manifest file (.trex) is an XML-based file. As part of the registration process, the .trex file validated against the XML schema definition file (XSD). If there are schema violations with the .trex file, the extension cannot be registered and XSD errors are written to the Tableau log file. The first error specifies the type of error and the name of the manifest file.
Error: Registration Failed: XSD Validation Failed
file: Sample.trex
Each XSD validation error in the file is logged separately, which makes it easier to locate and fix problems. For example, the following error shows the exact line number and location where the error occurred. In this case, the value for extension-version number was left blank "".
Error: Error(2,86): value '' does not match regular expression facet '[0-9]\.[0-9]' (id: C:\Users\me\Documents\My Tableau Repository (Beta)\Extensions\Sample.trex)
file: Sample.trex
Track extension activity
In addition to troubleshooting errors during registration, you can track extension activity. There are other types of events that are reported with the extension keyword, such as successful registration, and command execution. The following section walks through the events that occur when the extension is successfully registered, and then placed on the dashboard.
Successful registration
When no errors are found with the manifest file, Tableau completes the registration process and writes Extension Successfully Registered to the log file. At this point, the extension is available for use.
Event: Extension Successfully Registered
id: com.tableau.extensions.dashboard.tutorial.final
name: Tutorial - Complete
You can use the id of the extension, in this case com.tableau.extensions.dashboard.tutorial.final to search for instances where the extension is used.
Drop-on-dashboard
When you drag an extension on to the dashboard a series of events take place. Using the id of the extension, you can find the sequence of command-pre and command-post tabdoc events that place the extension in the dashboard.
args: tabdoc:drop-on-dashboard add-as-floating="false" dashboard="Overview" drop-location={"x": 36,"y": 259} is-horizontal="false" zone-param="com.tableau.extensions.dashboard.tutorial.final" zone-type="add-in"
name: tabdoc:drop-on-dashboard
Extension initialization
After an extension has been placed in a dashboard, an initialization sequence begins.
Event: Executing Command: initialize-add-in-instance
id: com.tableau.extensions.dashboard.tutorial.final
instance-id: com.tableau.extensions.dashboard.tutorial.final
name: Tutorial - Complete
A key part of this is that the extension is assigned an add-in-instance-id. This instance id is something you can use to further track activity.
args: tabdoc:initialize-add-in-instance add-in-locator-pres-model={"add-in-instance-id": "36C4012514F042DB8F2AB466B445726A","sheet-path":{"sheet-name": "Overview","is-dashboard": true}}
name: tabdoc:initialize-add-in-instance
Executing Save-Settings
In this example, the extension we are following calls tableau.extensions.settings.saveAsync() function when a selection has been made.
Event: Executing Command: save-add-in-settings
id: com.tableau.extensions.dashboard.tutorial.final
instance-id: com.tableau.extensions.dashboard.tutorial.final
name: Tutorial - Complete
In this case, the selection was the name of a worksheet (“Sale Map”).
 args: tabdoc:save-add-in-settings add-in-locator-pres-model={"add-in-instance-id": "36C4012514F042DB8F2AB466B445726A","sheet-path":{"sheet-name": "Overview","is-dashboard": true}} add-in-settings={"sheet":"Sale Map"}
name: tabdoc:save-add-in-settings
You can use the information in the log file to help you track activity, and to help you troubleshoot problems with extension registration.
List of extension events
| Error | Description |
|---|---|
| Duplication error | Manifests with the same id. The id and file name are logged. |
| XSD Validation error | Details of the errors are logged in separate messages. The file name is logged |
| Info | Description |
|---|---|
| Registration success | The id and name of the extension. |
| Command Execution | Logs when and what command the extension is executing. The Id, instance-Id, and extension name are logged as well. |