Debug Extensions in Tableau Desktop
A dashboard extension embeds a web page and runs a Chromium-based browser inside of Tableau Desktop. Fortunately, you can debug this embedded web browser using the remote debugging abilities built into Chromium.
Debugging an extension involves starting Tableau with a command option to enable remote debugging (over a debug port). You can then run a specific version of the Chromium debugger and connect to Tableau Desktop using the debug port.
In this section
- Download the Chromium Browser
- Start Tableau Desktop and enable debugging (Windows)
- Start Tableau Desktop and enable debugging (macOS)
- Debugging Tableau Desktop using Chrome/Chromium
- Debugging loading and initialization issues (Tableau 2021.1 and later)
- Debugging loading and initialization issues (Tableau 2020.4 and earlier)
- Known issues with debugging extensions in Tableau Desktop
Download the Chromium Browser
To debug your extension, you’ll need to use a Chromium-based browser (Chromium is the open-source version of Chrome). In some cases you could use Chrome, but because of version incompatibilities in the debugging protocol, we recommend using specific builds of Chromium, which matches the version of the browser running inside Tableau. Just download and unzip the file and run chrome.exe (Windows) or chromium (macOS).
| Tableau Desktop version | Chromium version | Chrome version |
|---|---|---|
| 2018.2, 2018.3 | 47.0.2526.0 | Not available |
| 2019.1 and later | 79.0.3945.0 | Chrome version 79 or earlier. |
| Latest maintenance release of 2020.2.7+, 2020.3.6+, 2020.4.2+ | 87.0.4280 | Chrome version 80 or later. |
| 2021.1 and later | 87.0.4280 | Chrome version 80 or later. |
Chromium downloads for debugging Tableau 2018.2, 2018.3
Chromium downloads for debugging Tableau 2019.1 and later
Start Tableau Desktop and enable debugging (Windows)
- Exit Tableau if it is already running on your computer.
- Open a Command Prompt window.
- Start Tableau using the following command.
Replace<version>with the version of Tableau you are using (for example,Tableau 2018.3).
"C:\Program Files\Tableau\Tableau <version>\bin\tableau.exe" --remote-debugging-port=8696
This command enables remote debugging of extensions for this session of Tableau.
Note: The remote debugging port (for example, 8696) must match the port address you use with Chromium for debugging. This is not the HTTP port that you are using to host your extension, the port that is specified in the manifest file (.trex).
Optional - Create a Tableau shortcut for debugging (Windows)
For convenience, you could also create a shortcut for Tableau and add the remote debugging option to Properties dialog box.
- Select Tableau from the Start menu, and then right-click and select Properties or select Open file location.
If you open the file location, you can create a new shortcut toTableau.exe(call it something like Tableau - Debug ). Right click the shortcut to open the Properties dialog box. -
In the Properties dialog box, append
-remote-debugging-port=8696at the end of the command in the Target text box. The debugging option goes after the closing quotation mark for"Tableau.exe".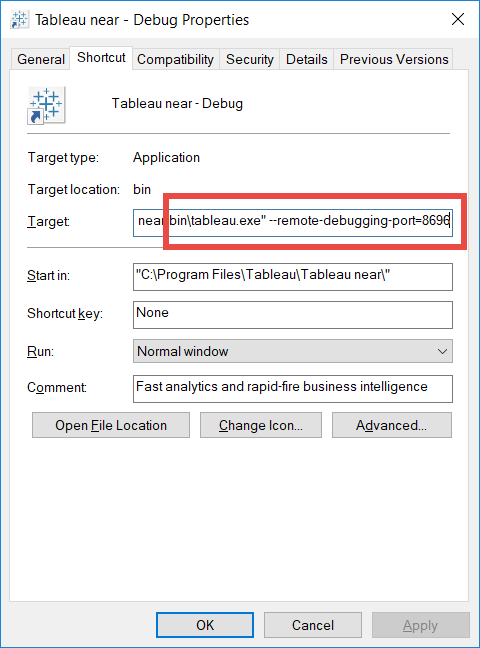
Start Tableau Desktop and enable debugging (macOS)
- Open a Terminal window.
-
Start Tableau using the following command.
Replace<version>with the version of Tableau you are using (for example,2018.3.app).open /Applications/Tableau\ Desktop\ <version>.app --args --remote-debugging-port=8696
This command enables remote debugging of extensions for this session of Tableau.
Note: The remote debugging port (for example, 8696) must match the port address you use with Chromium for debugging. This is not the HTTP port that you are using to host your extension, the port that is specified in the manifest file (.trex).
Debugging Tableau Desktop using Chrome/Chromium
After you install the Chrome (or Chromium) browser and enable debugging in Tableau, you can start debugging your extension.
- Open the dashboard with the extension you want to debug in Tableau.
- Start Chromium and set the URL to
http://localhost:8696
This will bring up the page selector UI. The port (for example,8696) must match the port address you specified as the remote debugging port when you started Tableau. -
Pick the extension you want to debug from this page, and debug just like you would any other web application (set breakpoints, step through the code, and examine variables).
Note that the name of the extension is based on the title of the web page that was loaded for the extension. If the extension hasn’t loaded yet the name might be blank. See Debugging loading and initialization issues.
Note that you can only debug one extension, or instance of an extension, at a time. However, you can open a new Chromium tab or window to debug additional extensions.
Debugging loading and initialization issues (Tableau 2021.1 and later)
If you need to troubleshoot or debug issues that prevent your extension from loading or initializing, you can set breakpoints that trigger when your JavaScript code is loaded.
-
Start the debugging session as described in Debugging Tableau Desktop using Chrome/Chromium.
-
Click the Sources tab in Chrome/Chromium, under Event Listener Breakpoints, click Script and enable the Script First Statement breakpoint. You just have to do this one time.
-
In Tableau Desktop, select the extension in the dashboard and click Reload from the More Options shortcut menu.
The debugger will pause each time the first statement of a script runs, allowing you to debug the startup process. -
To get to your JavaScript code, click Continue several times. After your JavaScript is loaded, you can set a breakpoint in your startup code.
Debugging loading and initialization issues (Tableau 2020.4 and earlier)
It can be difficult to hit breakpoints that occur during the loading of your page because of the remote debugging process, and because of the way loading was handled prior to Tableau 2021.1. To help with this, you can select a menu option that causes your extension to wait to load until you trigger it to proceed.
- Select the extension in the dashboard and select Debug Options > Pause Before Loading from the shortcut menu.
- Reload your extension. Select Reload from the shortcut menu.
- In Chromium, go to the debugging homepage (http://localhost:8696).
- Click the second item listed to attach to the browser instance of your extension.
Note: When you click the list item, it will be completely blank, but it is really there. The cursor changes so you can select it. - Click the Sources tab in Chromium, under Event Listener Breakpoints, click Script and enable the Script First Statement breakpoint. You just have to do this one time.
- In Tableau Desktop, click the extension zone to load your page.
The debugger will pause each time the first statement of a script runs, allowing you to debug the startup process. - To get to your JavaScript code, click Continue several times. After your JavaScript is loaded, you can set a breakpoint in your startup code.
Known issues with debugging extensions in Tableau Desktop
Reload closes debugging connection (2020.1 and earlier)
While you are debugging your extension, there are times you might want to reload or refresh your web page to execute and debug different parts of your code. However, when you click Reload from the shortcut menu to reload your extension, the remote debugger loses the connection with the extension. The reason for this is that Reload option tears down and re-creates the browser control, which means you’ll need to establish a new debugging session.
Note that you do not need to close and reopen the Chromium browser every time you click Reload. You can start another debugging session by entering the URL (http://localhost:8696) in the Chromium address bar and selecting the extension from the page selector.
For more information, see What Happens When You Reload an Extension.