Tableau Viz v2 inputSpec
The createVizImageAsync method takes a single argument, the inputSpec, a JavaScript object, and returns the SVG description of that image.
Starting with Tableau 2022.3, you can use version 2 of the inputSpec to create combination charts and dual-axis visualizations.
Version 2 of the inputSpec allows you to specify different mark types for the measures along the encoding axis (either rows or columns).
For versions of Tableau prior to 2022.3, you can use the Tableau Viz v1 inputSpec. The Tableau Viz v1 is supported in Tableau 2021.3 (and later). See the Tableau Viz v1 inputSpec.
In this section
- The createVizImageAsync method
- Specification for
inputSpec(version 2) object - Description of
inputSpec(version 2) properties
The createVizImageAsync method
The createVizImageAsync method is one of the methods in the Tableau Dashboard Extensions API extensions namespace. The method has the following syntax:
createVizImageAsync( inputSpec: *object* ): Promise<string>
This method takes a single argument, the inputSpec, a JavaScript object, and returns the SVG description of that image. To call this method, you first initialize the Dashboard Extensions API (tableau.extensions.initialize()). You then create the inputSpec object that defines your graphic.
For more information about the method, see tableau.extensions.createVizImageAsync in the Dashboard Extensions API reference.
Specification for inputSpec (version 2) object
The inputSpec is a JavaScript object that specifies the name-value pairs to use to create the SVG image. The object consists of the data and the properties that specify how to format the data, for example, vizlayout, columns, rows, encodingaxis and encodings. The data is an array of objects. The data is listed in row-level order, where each object represents one item. The mark property specifies the type of marks to use for the measures on the encoding axis in the image. For example, if you have two continous fields on the coulmns shelf, you can specify columns as the encodingaxis and set the marks to different types (bar, line, area, circle, square, or text).
The following shows an example inputSpec that creates a combination chart image that specifies bar and area mark types for the Sales and Profits measures on the columns shelf.
{
    version: 2,
    description: 'Example Tableau Viz v2',
    data: {
      values: [
        { Segment: 'Consumer', ShipMode: 'First Class', Category: 'Technology', Profit: 11560.75, Sales: 61089.43 },
        { Segment: 'Corporate', ShipMode: 'First Class', Category: 'Technology', Profit: 7235.75, Sales: 39201.43 },
        { Segment: 'Home Office', ShipMode: 'First Class', Category: 'Technology', Profit: 8706.75, Sales: 39074.43 },
      ],
    },
    vizlayout: {
      title: 'Example Tableau Viz v2',
    },
    columns: [
      { field: 'ShipMode', type: tableau.VizImageEncodingType.Discrete },
      { field: 'Sales', type: tableau.VizImageEncodingType.Continuous },
      { field: 'Profit', type: tableau.VizImageEncodingType.Continuous },
    ],
    rows: [{ field: 'Segment', type: tableau.VizImageEncodingType.Discrete }],
    encodingaxis: 'columns',
    defaultencoding: { mark: tableau.MarkType.Bar },
    encodings: [
      {
        mark: tableau.MarkType.Bar,
      },
      {
        mark: tableau.MarkType.Area,
        color: { field: 'Category', type: tableau.VizImageEncodingType.Discrete, palette: { name: 'green_orange_cyan_yellow_10_0' } },
      },
    ],
  };
Description of inputSpec (version 2) properties
The following table describes the properties in version 2 of the inputSpec, the JavaScript object that you provide as input to the createVizImageAsync method
version
(Required) Specifies the version of the Tableau Viz. Only used for version 2 and later.
{
  version: 2,

 // ...

}
description
(Optional) A description about the visualization. Currently, the description is not used anywhere and is not visible when the image is generated. However, it might be helpful to use this description as you comment your code.
description: 'Example description',
data
(Required) The data to use to create the image. The data consists of an array of objects, specified with the "values" property. Data is listed in row level order, where each object represents one item.
    data: {
      values: [
        { Segment: 'Consumer', ShipMode: 'First Class', Category: 'Technology', Profit: 11560.75, Sales: 61089.43 },
        { Segment: 'Corporate', ShipMode: 'First Class', Category: 'Technology', Profit: 7235.75, Sales: 39201.43 },
        { Segment: 'Home Office', ShipMode: 'First Class', Category: 'Technology', Profit: 8706.75, Sales: 39074.43 },
      ],
    },
vizlayout
(Required) Contains information about the layout of the Tableau Viz. You can set the size of the layout and whether to show or hide the color and size legends. The vizlayout structure is required but specifying size, showcolorlegend, showsizelegend, showrowsgridline is optional.
Example:
vizlayout: {
    title: 'Example multi-pane viz',
    size: {width: 800, height: 600},
    showcolorlegend: true,
    showsizelegend: false,
    showcolumnsgridline: false,
    showrowsgridline: false,
},
vizlayout: title
(Optional)
(string) Specifies a title for the image.
vizlayout: size
(Optional)
Size of the viz requested (in pixels). Needs to be specified inside vizlayout.
vizlayout: {

    size: {width: 800, height: 600},

},
vizlayout: showsizelegend
(Optional)
(Boolean) Show size legend with the image. Needs to be specified inside vizlayout.
vizlayout: {

   showsizelegend: true,

},
vizlayout: showrowsgridline
(Optional)
(Boolean) Show the horizontal gridlines in the image. (Optional)
Needs to be specified inside vizlayout.
vizlayout: {

   showrowsgridline: true,

},
vizlayout: showcolumnsgridline
(Optional)
(Boolean) Show the vertical gridlines in the image. (Optional)
Needs to be specified inside vizlayout.
vizlayout: {

   showcolumnsgridline: true,

},
vizlayout: showcolorlegend
(Optional)
(Boolean) Show the color legend with the image. (Optional)
Needs to be specified inside vizlayout.
vizlayout: {

   showcolorlegend: true,

},
rows
An array of fields on the Tableau Rows shelf that represent the rows in the image. A row includes the name of the field to add and its type (continuous or discrete).
row properties
| Property | Value |
|---|---|
field |
The name of the field that appears on the Tableau Rows shelf. |
type |
The type of field, either tableau.VizImageEncodingType.Discrete (blue “pill”) or tableau.VizImageEncodingType.Continuous (green “pill”). |
For example, the following specifies that there is a single field on the Rows shelf, named “Segment.” The type can be either tableau.VizImageEncodingType.Continuous or tableau.VizImageEncodingType.Discrete.
rows:[
    { field: 'Segment', type: tableau.VizImageEncodingType.Discrete }
  ],
columns
An array of fields on the Tableau Columns shelf that represent the columns in the image. A column includes the name of the field and its type (continuous or discrete). The column can also specify an axis range (axisrange) that specifies the extent.
columns: attributes
| Property | Value |
|---|---|
field |
The name of the field that appears on the Tableau Column shelf. |
type |
The type of field, either tableau.VizImageEncodingType.Discrete (blue “pill”) or tableau.VizImageEncodingType.Continuous (green “pill”). |
title |
Specifies a custom axis title for the column. A title can only be used for continuous fields (tableau.VizImageEncodingType.Continuous). Custom titles for discrete fields are not supported. |
showtitle |
Boolean (true, false). Specifies whether to show or hide the custom column or row title. |
axisrange |
(Optional) If a custom fixed axis is requested, this structure specifies the extent. The syntax is axisrange: { fixed: true, min: min_value, max: max_value}. For more information about setting the axes in Tableau, see Edit Axes. |
For example, the following specifies that the “Sales” column has a fixed axis range of 0 to 10,0000.
columns:[
  {field:"Ship Mode", type: tableau.VizImageEncodingType.Discrete},
  {field:"Sales", type: tableau.VizImageEncodingType.Continuous, axisrange:{fixed: true, min: 0, max: 100000}},
  {field:"Profit", type: tableau.VizImageEncodingType.Continuous}
  ],
encodingaxis
Specifies the primary shelf for encoding. The encodingaxis determines which continuous measures to use for the axis. The encodings property is where you specify the encoding for the continuous fields on that axis.
encodingaxis: 'columns',
For example, if you have multiple panes on columns, you would specify columns. Using the following definition for columns, the marks for continuous measures would be Sales and Profit.
columns:[
  {field:"Ship Mode", type: tableau.VizImageEncodingType.Discrete},
  {field:"Sales", type: tableau.VizImageEncodingType.Continuous, axisrange:{fixed: true, min: 0, max: 100000}},
  {field:"Profit", type: tableau.VizImageEncodingType.Continuous}
  ],
defaultencoding
(Required) Specifies the default encoding in Tableau. This is mandatory encoding information that applies to all panes in the viz. The default setting can be overridden with encodings per field. This property corresponds to the “All” encoding on the Marks card in Tableau.
The defaultencoding is a structure that describes the default mark encoding. Supported mark types include: tableau.MarkType.Bar, tableau.MarkType.Line, tableau.MarkType.Area, tableau.MarkType.Square, tableau.MarkType.Circle, tableau.MarkType.Text.
For example, the following sets the default mark type as bar (tableau.MarkType.Bar).
defaultencoding: { mark: tableau.MarkType.Bar },
encodings
(Optional) This property describes how you want to encode the continuous fields on the specified encodings axis, that is, either the rows or columns shelf in Tableuu. The encodings shelf is specified with the encodingaxis property. You can assign a different mark type to each continuous field to create multiple pane or combination charts. If specified, the number of encoding structures should exactly match the number of continuous measures on the encoding axis.
The endocdings element corresponds to the Marks card in Tableau and describes how the marks for continous fields discrete fields are encoded. In Tableau, when you drag fields onto the properties on the Marks card it encodes the data in the view. Similarly, the encodings property lets you set the properties of the marks for the image.
You can also map fields to the color, size, and text properties, but you can only specify mark types for continous fields on the encodding axis.
Note that if there are multiple continuous fields on both columns and rows, only one set of them will get their own marks card: the first set. If you add multiple continuous fields to rows and then add multiple continous fields to columns, there will only be marks cards for each of the continuous fields on rows.
Within these properties, you must specify the field to encode and its type (tableau.VizImageEncodingType.Continuous or tableau.VizImageEncodingType.Discrete). Some properties allow you to set additional values as shown in the following table.
encodings: mark
(Optional) Supported mark types include: tableau.MarkType.Bar, tableau.MarkType.Line, tableau.MarkType.Area, tableau.MarkType.Square, tableau.MarkType.Circle, tableau.MarkType.Text. If no mark type is specified, the generated image will use the mark type specified as part of the defaultencoding prpoerty.
encodings: color
The color property corresponds to the Color button on the Marks card. The color can contain additional properties:
| Property | Value |
|---|---|
field |
The name of the field to encode. |
type |
The way the data is distributed in the view (discrete or continuous). |
palette |
Specifies color encoding for the field from the Tableau palette. Note that there are separate palettes for discrete or continuous fields. You can also create custom color palettes for continuous fields. See Create Custom Color Palettes. You specify the palette as a structure palette: { name: 'string_value'). |
palette names for continuous fields
You can specify one of the following Tableau color palettes with the palette property for continuous fields. Note that the list of available palettes depends upon the version of Tableau that is being used. Be aware that the palette colors are subject to change.
The following is an example that shows how you might encode a continuous field with a Tableau palette. You can also create custom color palettes for continuous fields. See Create Custom Color Palettes.
encodings: [
    {
     mark: tableau.MarkType.Bar,
   }
   {
     mark: tableau.MarkType.Area,

    color: { field: 'Measure', type: tableau.VizImageEncodingType.Continous, palette:{name: 'green_blue_white_diverging_10_0'}},
   }
],
| Continuous colors palettes | Palette name |
|---|---|
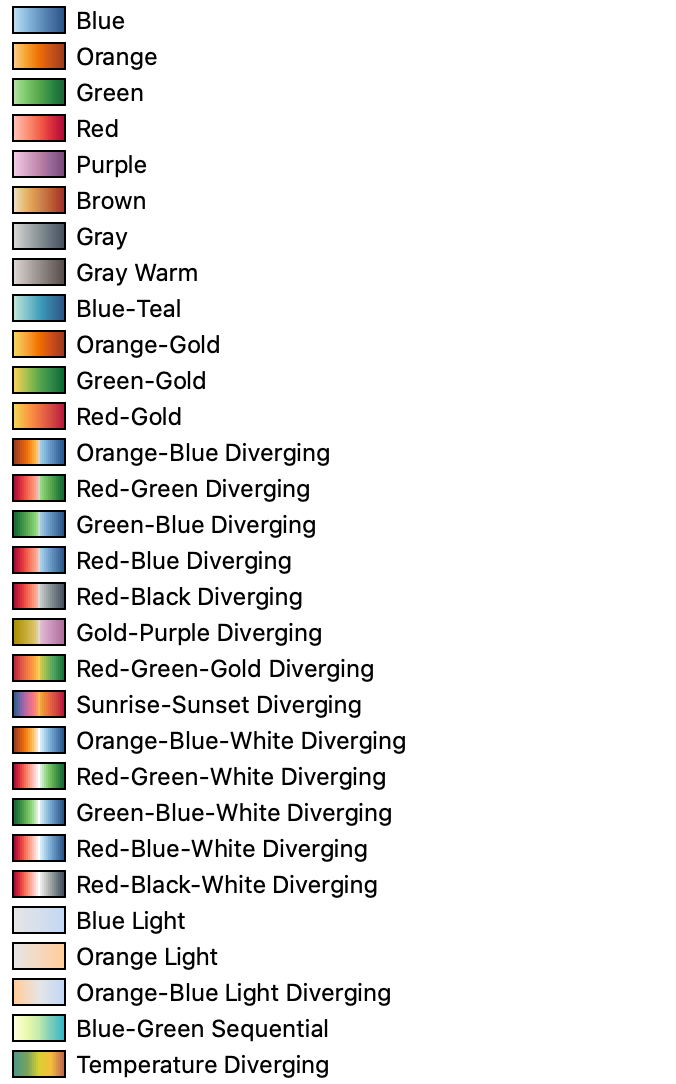 |
blue_10_0 orange_10_0 green_10_0 red_10_0 purple_10_0 brown_10_0 gray_10_0 gray_warm_10_0 blue_teal_10_0 orange_gold_10_0 green_gold_10_0 red_gold_10_0 orange_blue_diverging_10_0 red_green_diverging_10_0 green_blue_diverging_10_0 red_blue_diverging_10_0 red_black_10_0 gold_purple_diverging_10_0 red_green_gold_diverging_10_0 sunrise_sunset_diverging_10_0 orange_blue_white_diverging_10_0 red_green_white_diverging_10_0 green_blue_white_diverging_10_0 red_blue_white_diverging_10_0 red_black_white_diverging_10_0 tableau-blue-light tableau-orange-light tableau-orange-blue-light tableau-map-blue-green tableau-map-temperatur |
palette names for discrete fields
You can specify one of the following Tableau color palettes with the palette property for discrete fields. Note that the list of available palettes depends upon the version of Tableau that is being used. Be aware that the palette colors are subject to change.
The following is an example that shows how you might encode a discrete field with a Tableau palette.
encoding: [
   {
     mark: tableau.MarkType.Bar,
   }
   {
     mark: tableau.MarkType.Area,
     color: { field: 'Category', type: tableau.VizImageEncodingType.Discrete, palette:{name:'seattle_grays_10_0'}},
   }
   ...
],
| Discrete color palettes | Palette name |
|---|---|
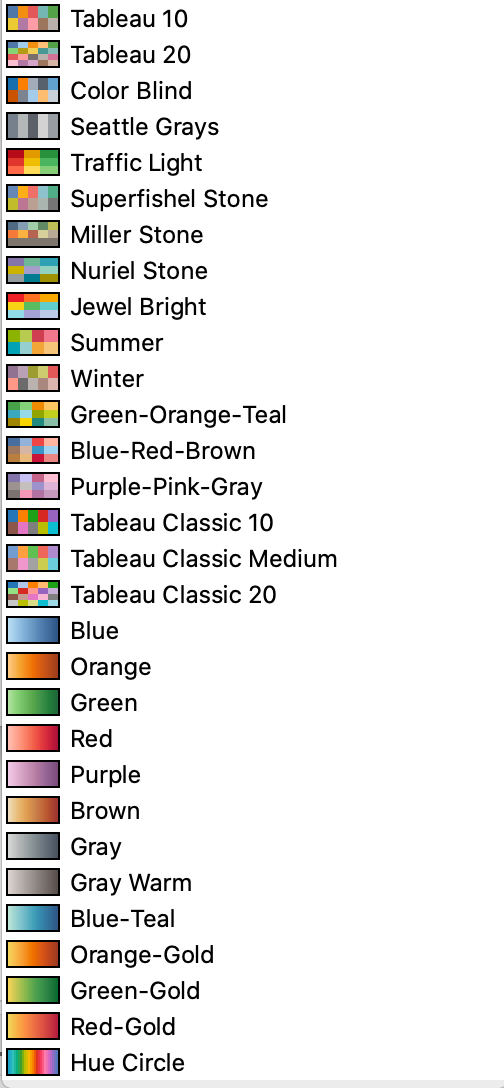 |
tableau10_10_0 tableau20_10_0 color_blind_10_0 seattle_grays_10_0traffic_light_10_0 superfishel_stone_10_0 miller_stone_10_0 nuriel_stone_10_0jewel_bright_10_0summer_10_0winter_10_0green_orange_cyan_yellow_10_0blue_red_brown_10_0purple_pink_gray_10_0tableau-10tableau-10-mediumtableau-20blue_10_0orange_10_0green_10_0red_10_0purple_10_0brown_10_0gray_10_0gray_warm_10_0blue_teal_10_0orange_gold_10_0green_gold_10_0red_gold_10_0cyclic_10_0 |
Create custom color palettes
You can set the color palette to a custom diverging or custom sequential color palette that you specify, and not just the Tableau defined palates, such as, green_blue_white_diverging_10_0.
| Custom Palette Property | Value |
|---|---|
tableau.VizImagePaletteType.CustomDiverging |
Defines a custom diverging palette. Specify the start value and an end value, each as a hexadecimal value. |
tableau.VizImagePaletteType.CustomSequential |
Defines a custom sequential palette. Specify the end value as a hexadecimal value. |
For example, you could set a custom palette as shown in the following examples:
palette: {name: tableau.VizImagePaletteType.CustomDiverging, start: "#FFB6C1", end: "#90ee90"},
Or
palette: {name: tableau.VizImagePaletteType.CustomSequential, end: "#FFB6C1"},