Fixing TDVT Test Failures
In this section
- Overview
- Set up TDVT Results Workbook with Test Data
- Using the Results Workbook
- Parts of a Test Case
- Triaging a specific TDVT Test Case
- Case 1: Error message is “Actual does not match expected”, Generated SQL is generated and actual tuples were retrieved
- Case 2: Error message is “No such function…”, no Generated SQL was generated and actual tuples is Null
- Case 3: The error originated from the driver or database, Generated SQL was generated and actual tuples is Null
- Case 4: The error originated from Tableau, no Generated SQL was generated and actual tuples is Null
Overview
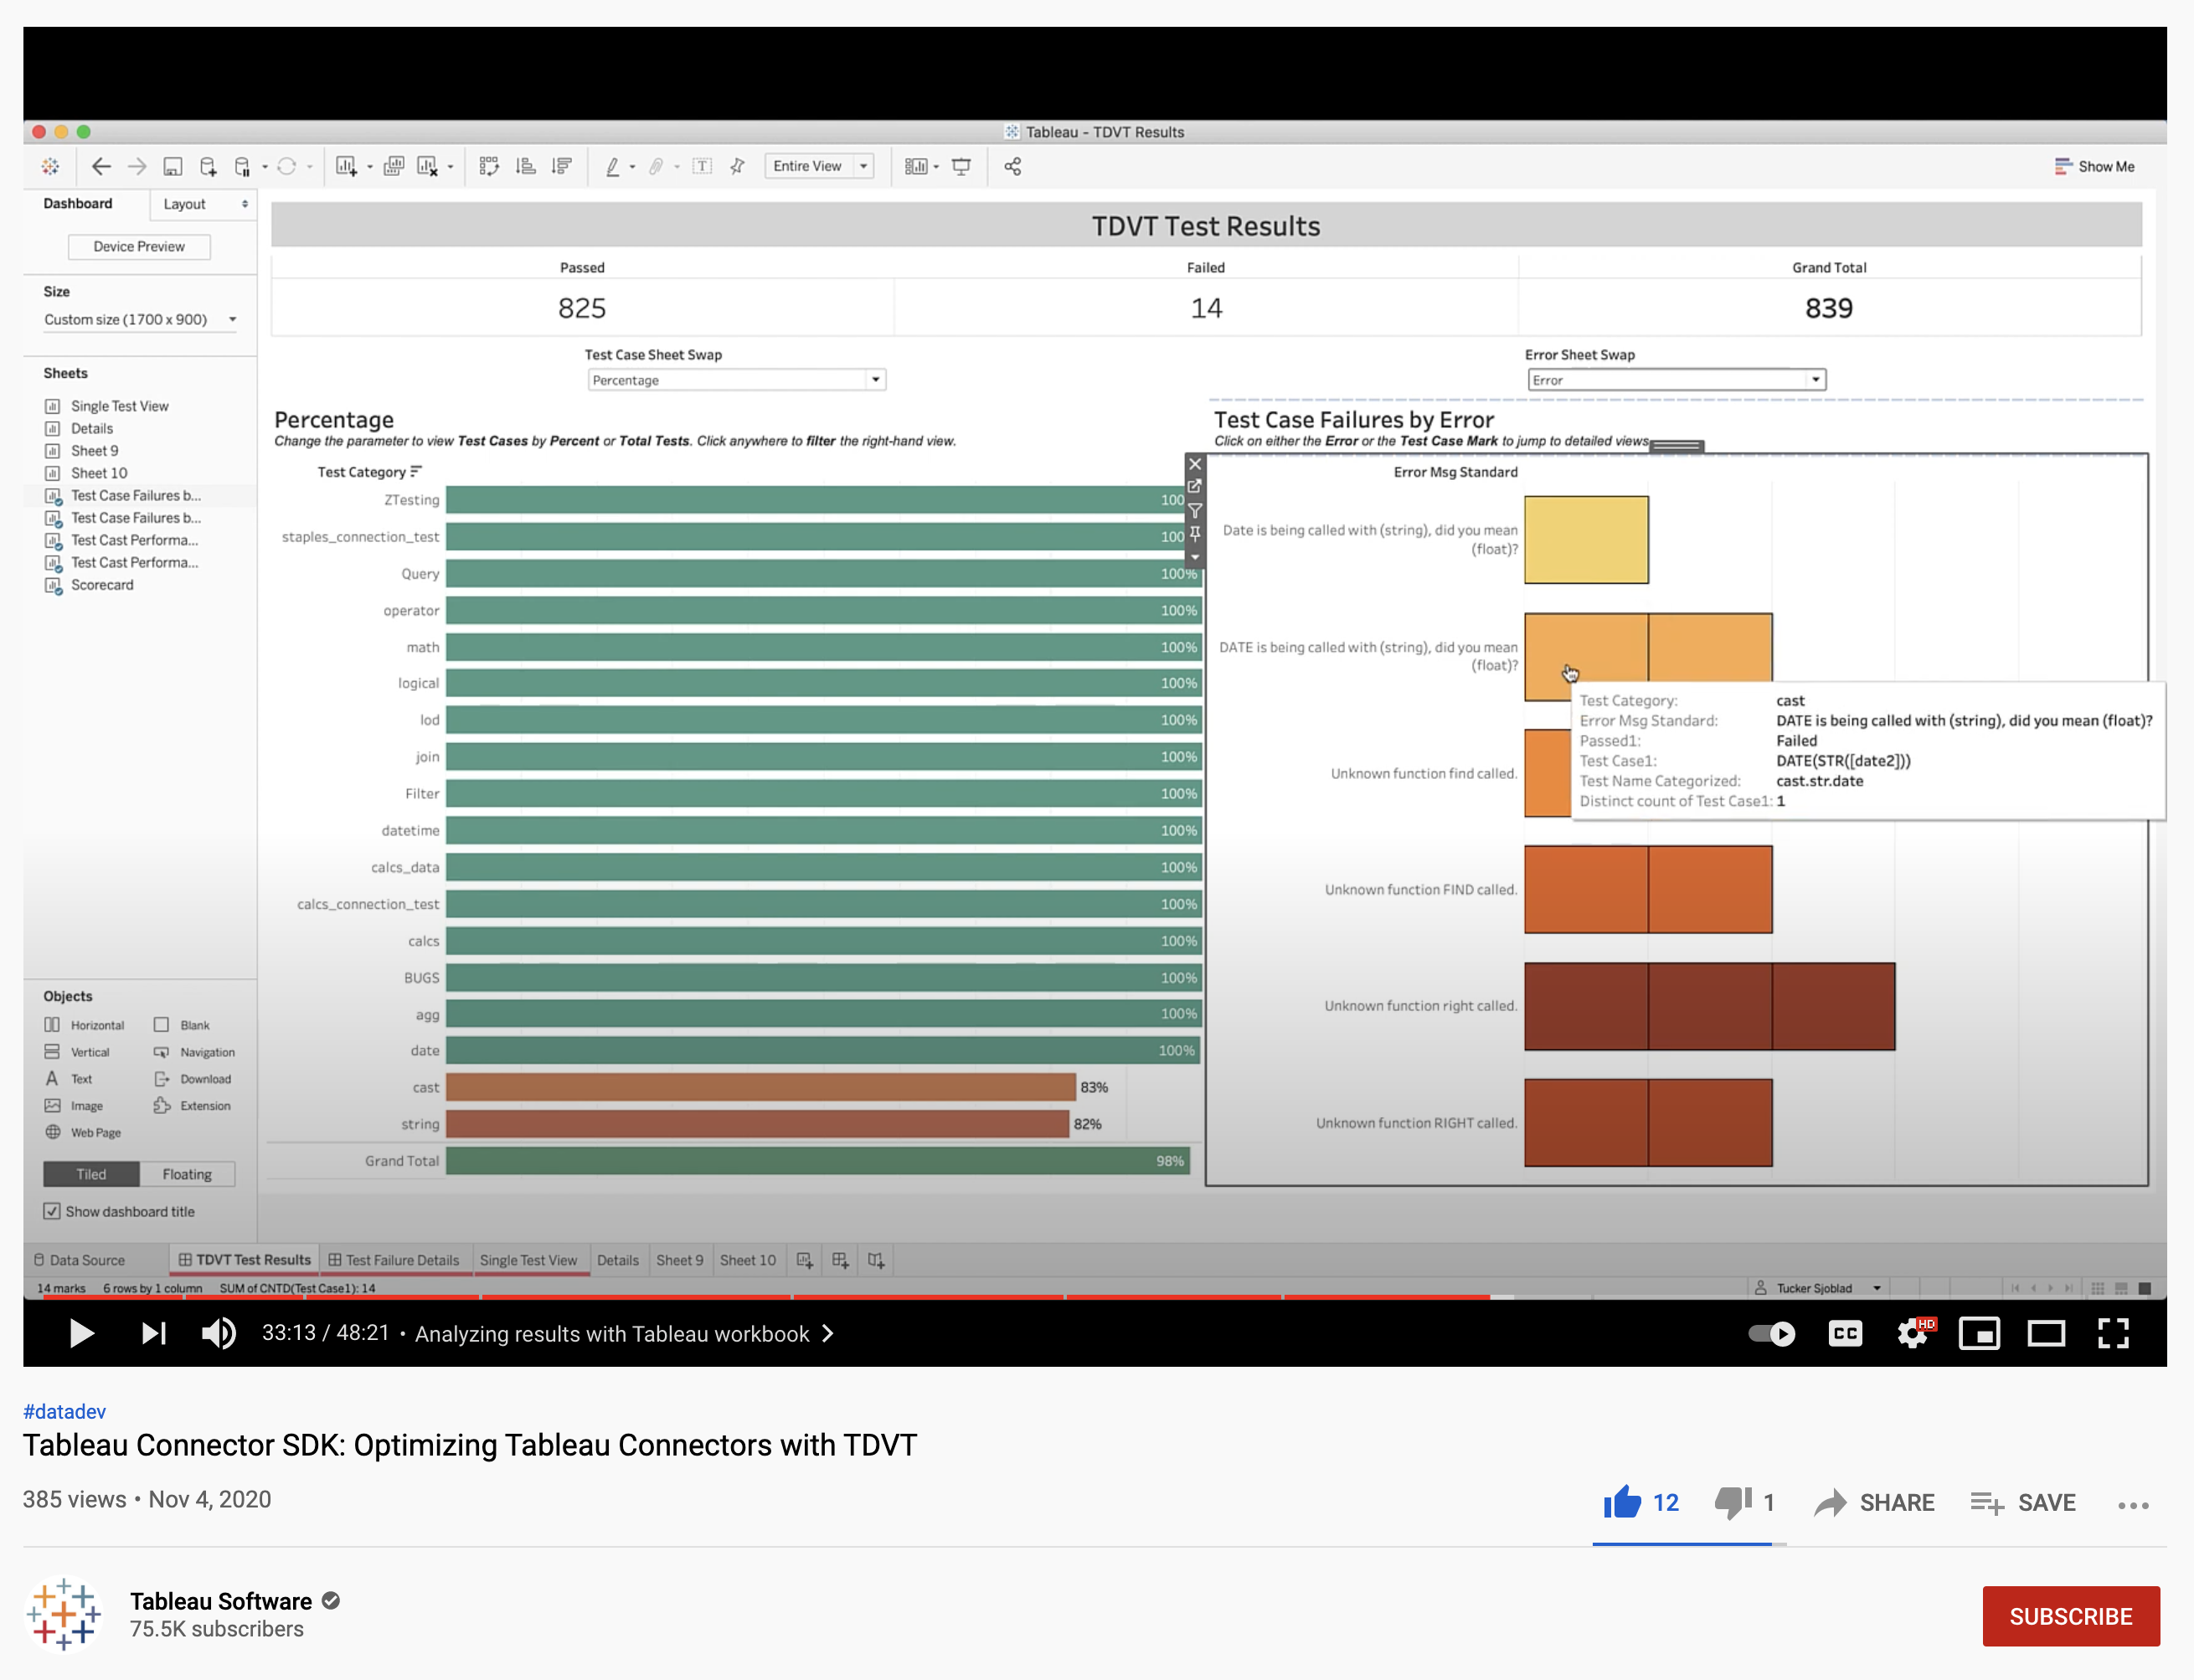
How to leverage the results workbook is explained step by step in our YouTube guide [28:26]. Running TDVT produces a CSV file with data on all the tests cases that were executed, and the best way to view data is, of course, in Tableau. We provide a TDVT Results Workbook that gives you a high-level overview on how many tests passed in each category and gives you tools to drill down to individual test cases and see the expected values versus actual values, the sql statement that was sent to the database, and any errors Tableau reported while running the test.

Set up TDVT Results Workbook with Test Data
To load in your test data, follow these steps:
- After the TDVT tests have run, you can use this workbook to analyze the results and improve performance of the connector.
- Start by navigating to the “Data Source” tab, clicking the “test_results” connection on the left-hand side, and selecting “Edit Connection”.
- From there, choose the relevant “test_results_combined.csv” from your latest test.
- Lastly, be sure to ensure the “Text File Properties” is set to use double quotes as the text qualifier.
Using the Results Workbook
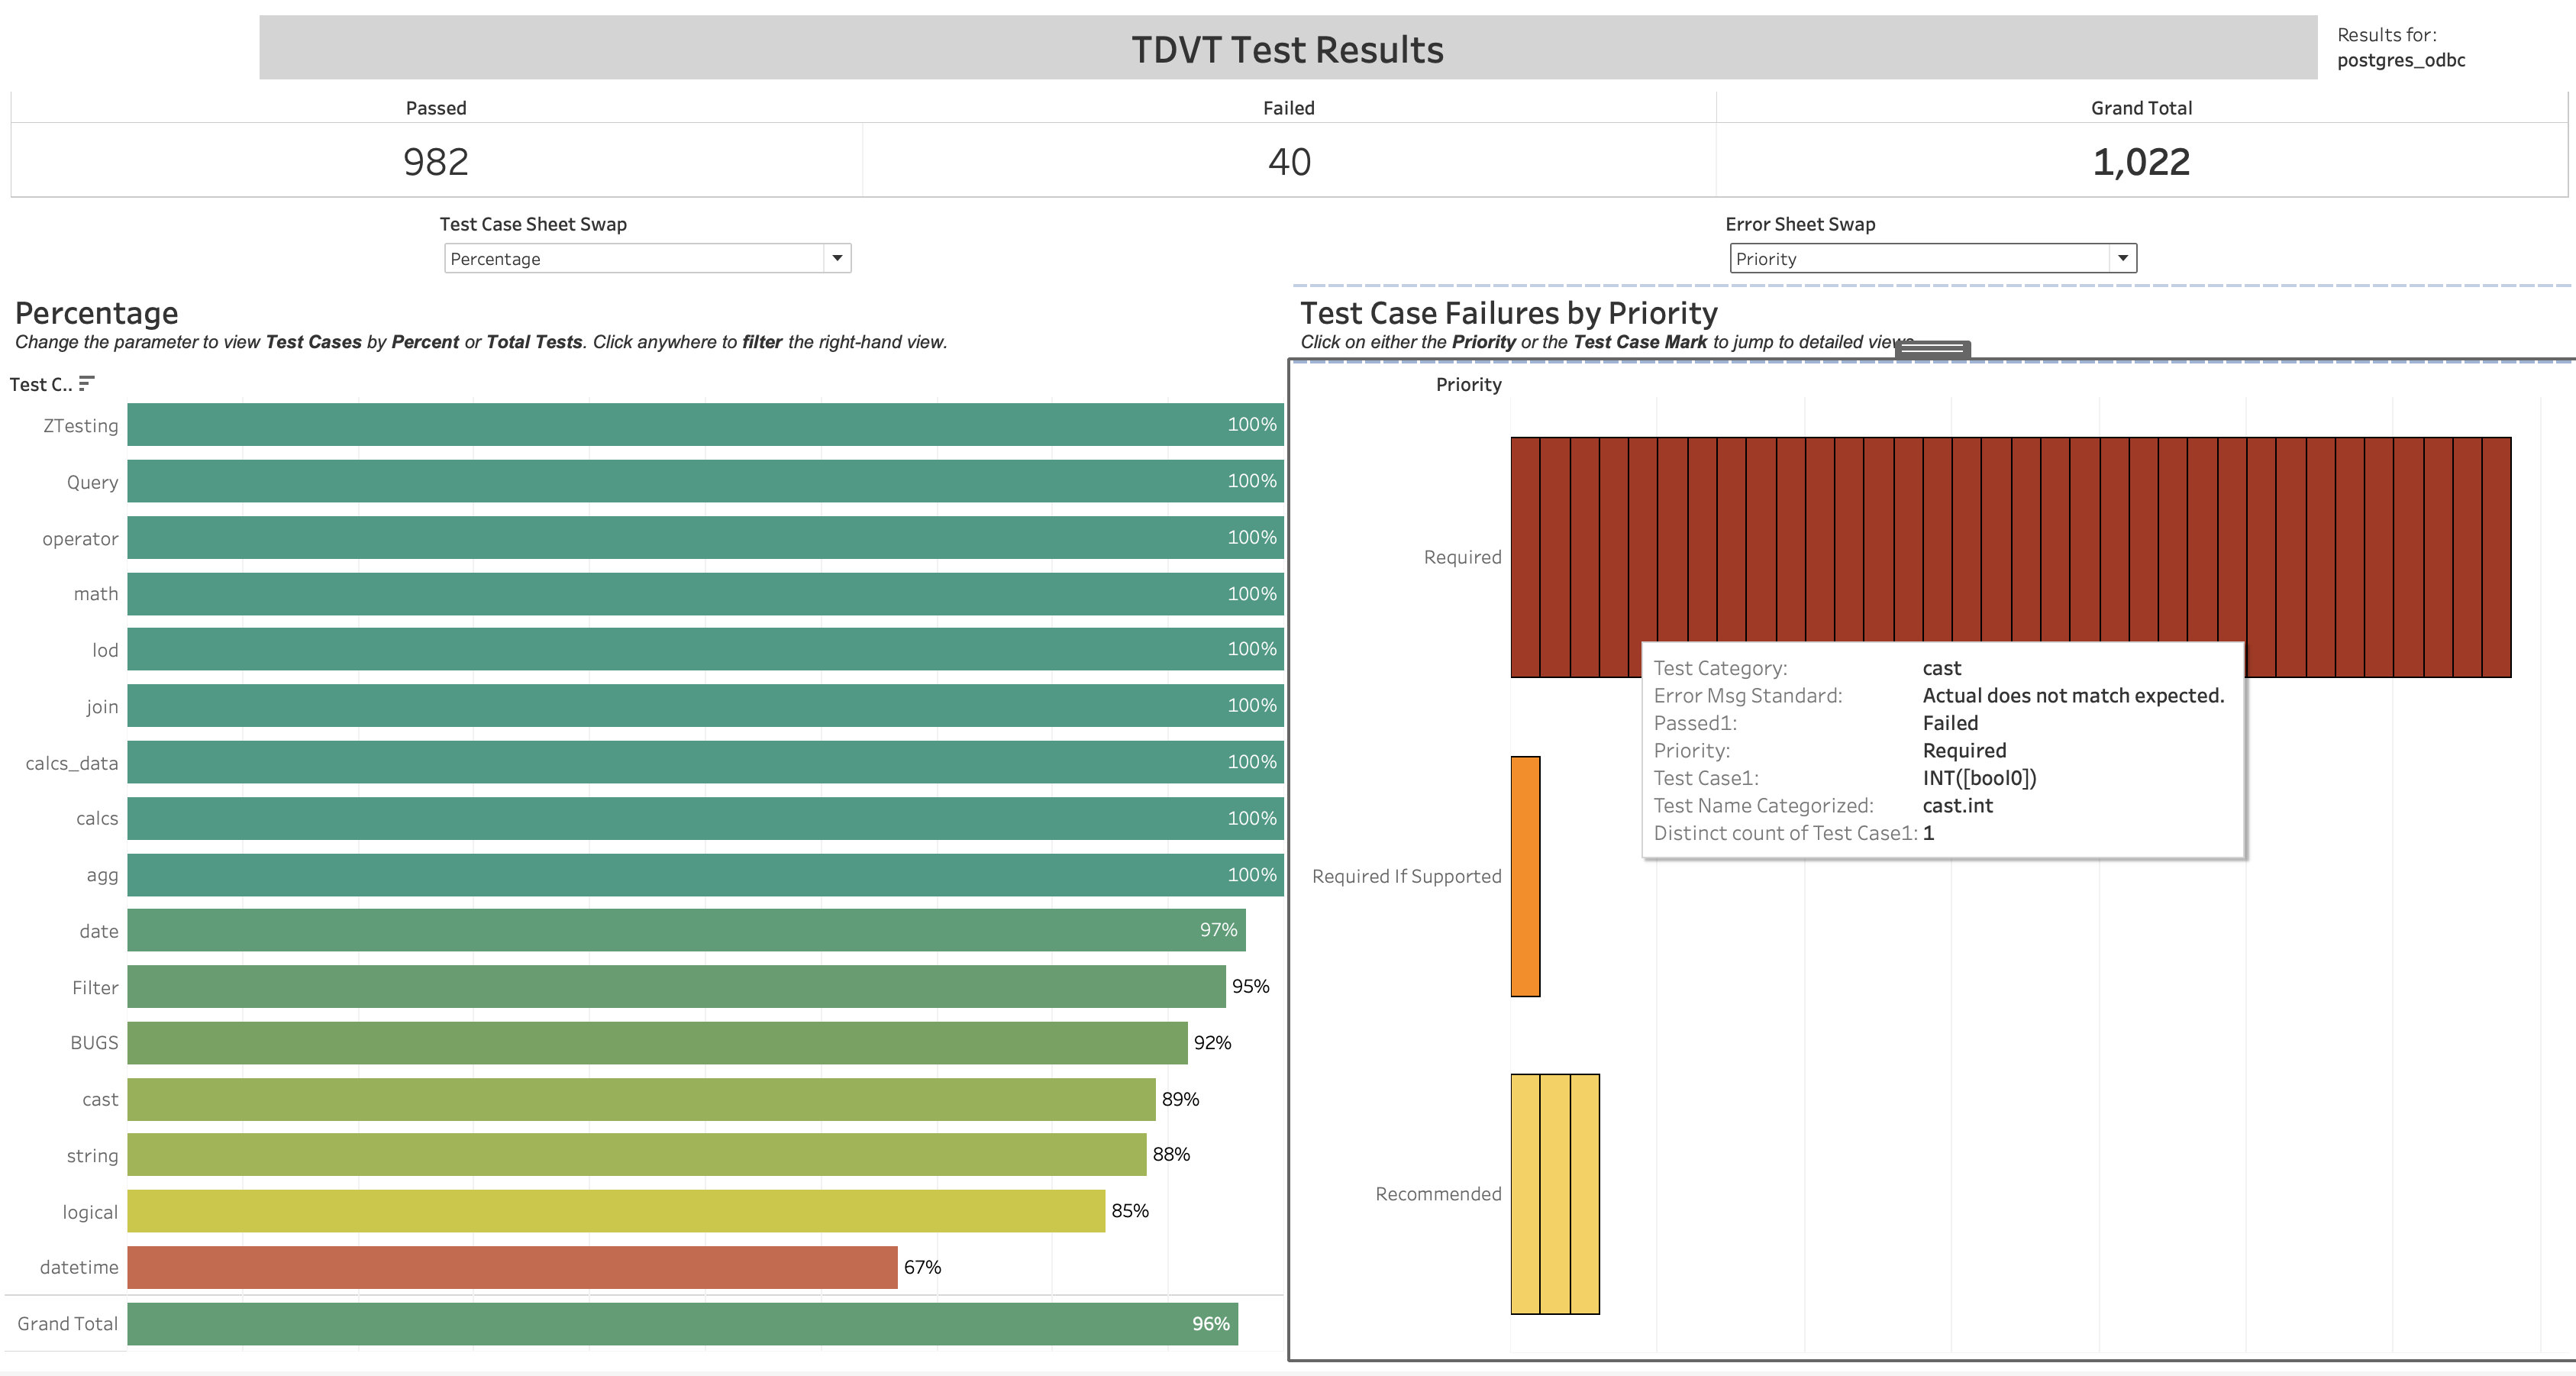
At a high level, it gives you an overview of your test runs, percentage tests passed, and lets you drill down and explore test failures across categories, by error messages, and more:

Click the bars on the right side of the dashboard to filter to individual test case failures, or filter by error message and priority:

Parts of a Test Case
One row of the test_results_combined.csv file you get from a TDVT run equals one test case. Each test case has the following columns:
| Column | Description |
|---|---|
| Suite | The overall test suite. Each suite has its own ini file and data source files, most TDVT runs only have one suite. |
| Test Set | Test sets are broad categories like logical, expression, and connection tests. |
| TDS Name | The tds file this test used. Should either be Staples.your_db.tds or cast_calcs.your_db.tds |
| TestName | The name of the test. Tests are a group of test cases that test one specific scenario or function. |
| TestPath | Path to the test file that defines the test, located in your tdvt package. |
| Passed | Either TRUE or FALSE, depending on if the test passed or failed. |
| Closest Expected | A number corresponding to the closest expected file that the actual tuples matched. 0 is the first expected file, 1 corresponds to the file ending in 1, and so on. |
| Diff count | Number of differences between actual and expected. |
| Test Case | The specific test case. For logical tests, this will point to the file that defines the query in XML. For expression, this is the Tableau calculation that was executed. |
| Test Type | Either expression or logical |
| Process Output | Output of the process, if any |
| Error msg | If Tableau runs into an error when executing the test case, it will be saved here. The error could originate from tableau, the driver, or the database. |
| Error Type | Either Error or None |
| Query Time (ms) | Execution time for the query in milliseconds. |
| Generated SQL | The full SQL generated by Tableau that is sent to the database for this test case. |
| Actual (100)tuples | The first 100 tuples received from the database after it executes the SQL Tableau sent |
| Expected (100)tuples | The tuples we expected. Note: This is always from the first expected file, which may not be the closest matching expected file. |
Triaging a specific TDVT Test Case
For a test that was run and failed, the “Error msg” column will tell you why the test failed. If the test was skipped, you probably have a configuration issue with TDVT and its connection to your database.
Case 1: Error message is “Actual does not match expected”, Generated SQL is generated and actual tuples were retrieved
In this case, Tableau sent a query to the database and received data, but the tuples sent back were incorrect.
Before digging too deep, consider the following cases:
-
Precision errors. A common problem is precision errors for floating point values, although the test framework imposes some rounding to standardize results. If the error is not significant then you can either skip the test or add a new expected file.
-
Misaligned date functions. Another common problem involves various date functions that might be off by a day. These can be caused by start of week errors (Sunday should be 1 and Saturday is 7). Other causes might include discrepancies around some start of week calculations or quarter boundaries. You may need to change your TDS file’s connection properties to have Sunday be the first day of the week (instructions can be found here)
If those cases do not apply, you’ll have to look deeper at the results you got and why it isn’t matching the expected values. Something that can help is to do the calculation on paper.
Let’s say that, for the agg.max test you are failing every one. For example, the MAX([int0]) test case, the actual result is 1 while the expected value is 11.
If this is an expression test, the test case column will tell you the exact calculation Tableau ran. In this case, that is MAX([int0]). We know that this test is using the calcs table because of the TDSName column, so we can get the values of int0 from that:
int0 = {1, null, null, null, 7, 3, 8, null, null, 8, 4, 10, null, 4, 11, 4, 8}
Looking at the numbers, you can see that 11 is the largest one, which matches the TDVT expected value. You can also see that the lowest number is 1, which is the actual value you got. In this contrived example, you can see that for the MAX function your connector is instead returning the MIN value.
Note: Some calculations return multiple values. In this case, Tableau merges all duplicate values together and then sorts them.
Note: The expected values listed in Actual Tuples are pulled from the first expected file, which may not be the closest matching expected file. For things like dates that have many potential formats, this could mean your actual results look nothing like the expected. In this case, use the “Closest Expected” column in the test case and look up the correct expected file.
Case 2: Error message is “No such function…”, no Generated SQL was generated and actual tuples is Null
This error occurs if your dialect does not implement a function and Tableau tries to use it. Adding the function to the dialect will fix this issue.
Case 3: The error originated from the driver or database, Generated SQL was generated and actual tuples is Null
If an error happened in the driver or database, you’ll need to use your knowledge of the database to triage the issue.
One common database error happens when the dialect is incorrect and sends bad SQL commands that the database can’t parse. This can happen a few different ways:
- The mapping from Tableau function to your database’s SQL protocol is incorrect. In this case, fixing the function in your dialect will fix the issue.
- Tableau constructed the SQL statement wrong, or in a way your database does not support. If the generated SQL includes an incorrect SELECT statement or GROUPS BY something it shouldn’t, you probably need to change your connector’s capabilities. Search the capabilities reference list to find the relevant Tableau capability.
Case 4: The error originated from Tableau, no Generated SQL was generated and actual tuples is Null
Other errors may occur. In most cases, the error message should be enough to diagnose and fix the issue. If not, you can open a GitHub issue to ask us about the error.