Example—TabPy
TabPy, the Tableau Python Server, is an Analytics Extension implementation which expands Tableau’s capabilities by allowing users to execute Python scripts and saved functions via Tableau’s table calculations or Table Extensions. TabPy is an open source project so you can see the implementation and documentation at https://github.com/tableau/TabPy.
Using TabPy to Cluster Tornado Origins
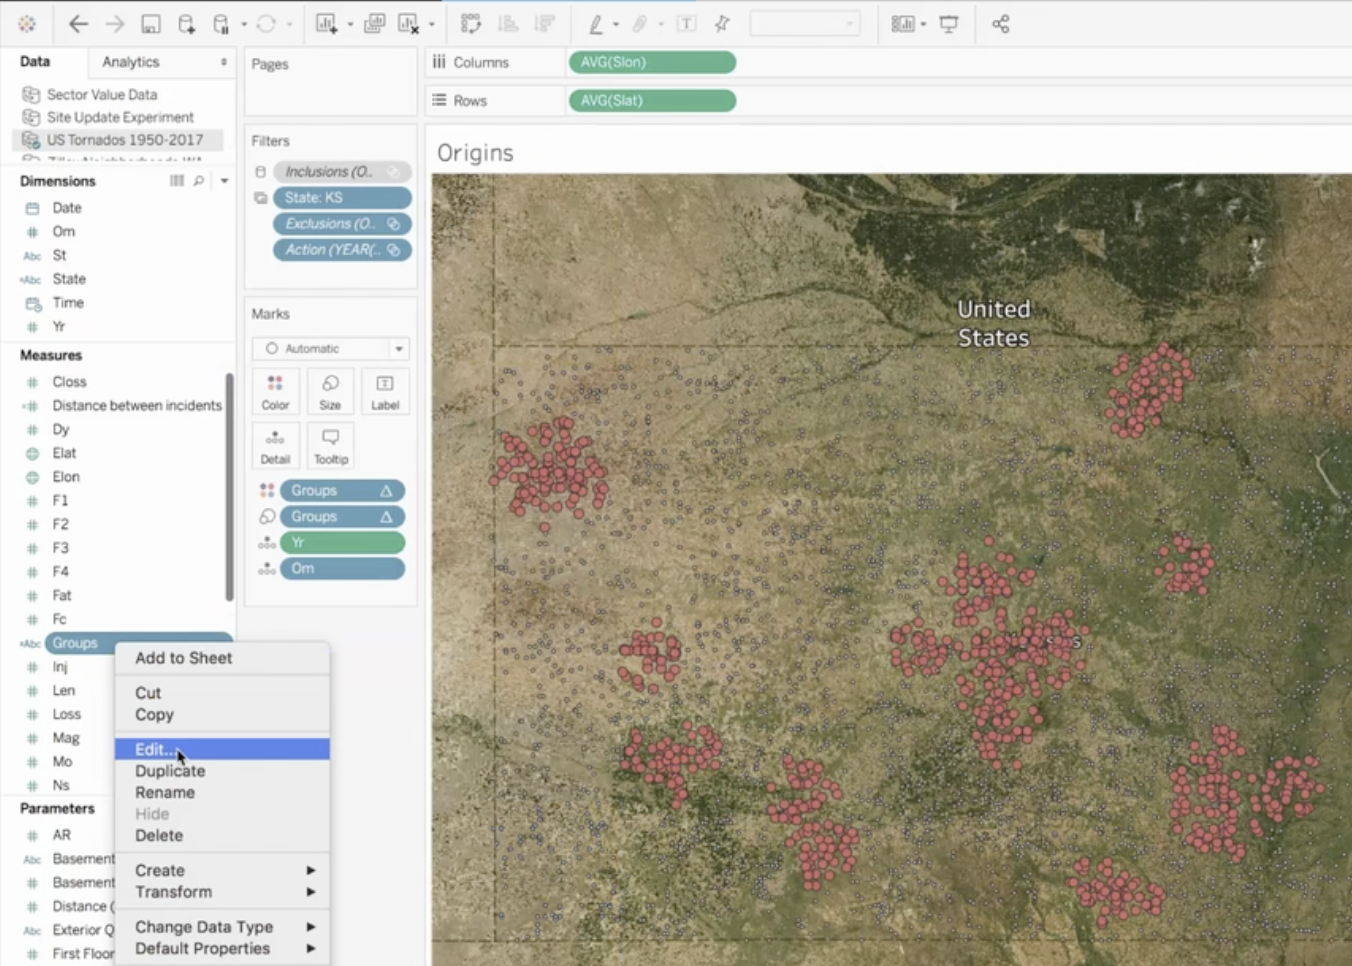
Here is an example of a workbook in Tableau Desktop that tracks tornado origin points in the USA to find areas where tornadoes are tightly clustered together. It uses the TabPy Analytics Extension to dynamically cluster the data using Python code. The Python code is inserted into a SCRIPT tag in the calculation for the Groups measure. It is being run dynamically as a calculated field and is being executed on a TabPy server and returned back to Tableau.
To view the script, right-click the Groups measure and click Edit.
The script is enclosed in a SCRIPT_STR block. It is passed the latitude and longitude of origin points of tornadoes.
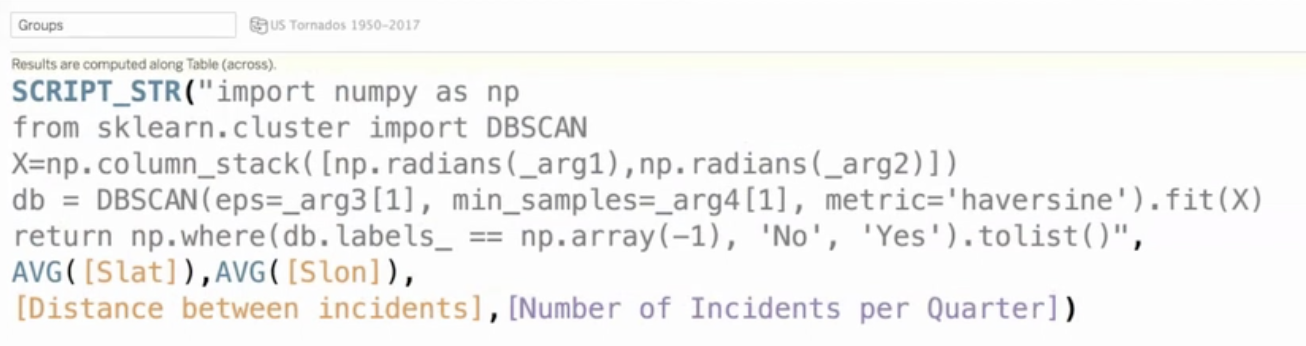
In this TabPy integration, you can change the data being fed into the calculation dynamically using filtering in the viz and you can change the parameters that are being fed into the model. The Python code and analytical clustering model are updated and recalculated in real time just like any calculated field but it’s being done in Python outside of Tableau.