Configuring TabMon
In this section:
Basic Configuration Options
TabMon utilizes two main application config files, located in the “Config” directory in the TabMon install location:
-
TabMon.config – Governs which machines will be monitored, how results will be written, and how often that performance will be sampled.
-
Counters.config – Specifies the set of performance counters that will be monitored.
Tabmon.config
Go to the install directory and modify the TabMon.config file as necessary. (Located in \Program Files (x86)\TabMon\Config\TabMon.config)
The default TabMon.config file looks like the following:
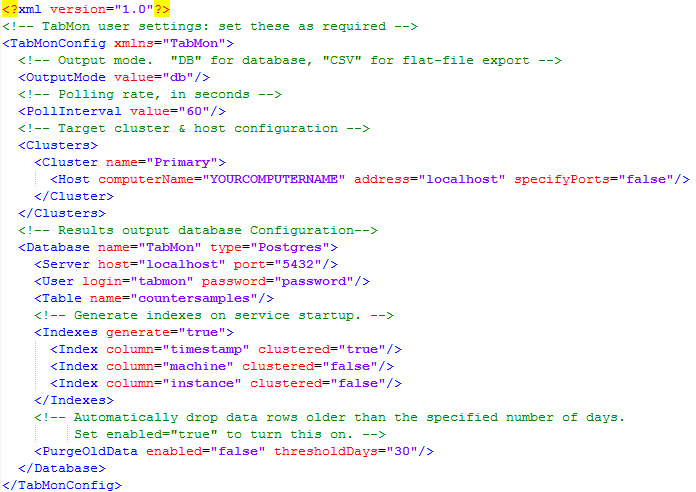
By default, this configuration will not poll PerfMon counters and will use base ports from the Counter.config. This configuration will not work with Tableau Server 2018.2+. In order to poll PerfMon counters, the computerName attribute must be changed to the specified host’s computer name (the FQDN may be necessary for environments with multiple domains) in the TabMon configuration file. To learn how to find the computer name, click here
Once the change above is complete, this configuration will poll the performance counters on localhost every 60 seconds and write out the results to the specified database.
In order to poll JMX counters from Tableau Server 2018.2+, specifyPorts will need to be enabled in the ‘Host’ entry of ‘TabMon.Config’ and the ports will need to be specified. The default ‘TabMon.Config’ with ‘specifyPorts’ enabled will look like this:
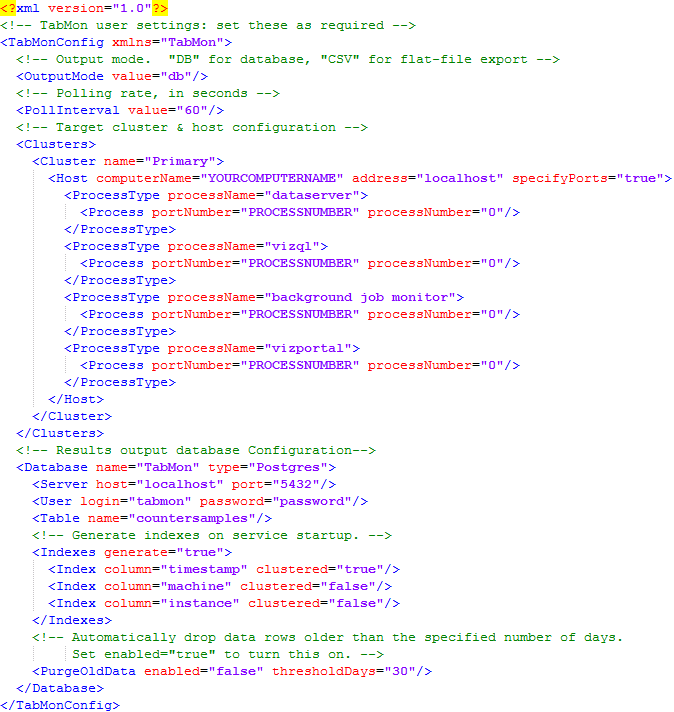
To manually configure the JMX ports, run the command below and copy the jmx port numbers from the output.
tsm topology list-ports
The four jmx processes that will need to be configured for full TabMon functionality are vizqlserver, vizportal, dataserver, and backgrounder. Each node in the topology output will need their own host entry in the TabMon config (including port numbers per jmx counter). Another option for creating the host section of the TabMon config is using the TabMonConfigBuilder utility that is included in TabMon version 1.3.
For more information on TabMonConfigBuilder, click here.
NOTE: If you changed your database parameters during setup, you will need to update them here.
Counters.config
The default Counters.config file comes with a good starter set of counters for monitoring Tableau Server 9.3 and 10.0. If you are using TabMon to monitor an older version of Tableau, you will need to overwrite this with the Counters.config file specific to your version, these are kept in the Resources\Configurations folder in the TabMon install directory. Note that if you switch your Counters.config file in this way, you should also switch to the appropriate version of the Sample Workbook (found in \Resources\Sample Workbooks).
Feel free to add or remove counters from Counters.config to suit your monitoring needs!
Advanced Configuration Options
There are a few optional advanced options you can configure TabMon with:
Export to CSV
- To export to CSV file, replace “db” with “csv” in the line
<OutputMode value=”db”/>. This causes counter data to be stored in a CSV file in a folder called “Results” in the main TabMon directory.
Remote Polling Setup
To poll data from a machine/machines other than your local host:
-
Add a new
<Host name=””>entry, with the name set to the network name or IP address of the target machine. You can nest multiple hosts within a “Cluster” element to logically group them. -
Ensure that the “Remote Registry” and “Performance Logs & Alerts” Windows services are running and set to Start Mode: Automatic on all remote machines.
-
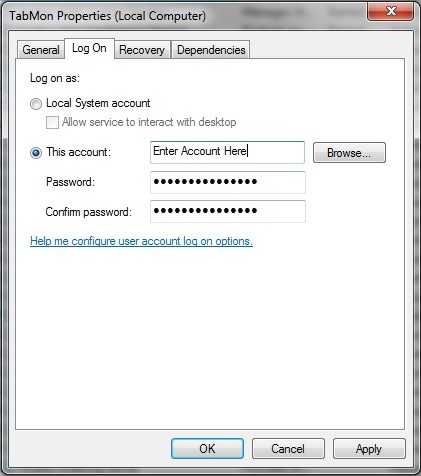
On the TabMon machine, go to Services and right click and select properties for “TabMon”. Make sure that the account for logon has privileges on the machine you would like to remotely connect to. Specifically, the service account must:
i. On each server you wish to remotely monitor: have admin permissions or be a member of the “Performance Monitor Users” and “Performance Log Users” domain group
ii. On the machine where TabMon is installed: have permissions to run as a service and write to the TabMon install directory.
Set a Data Retention Threshold
TabMon generates a lot of data, especially when using an aggressive polling rate. To help manage this, when using TabMon to output to database, you can set a data retention threshold so that old data is automatically dropped.
To set this, open up TabMon.config and find the following line:
<PurgeOldData enabled="false" thresholdDays="30"/>
Change the enabled attribute from false to true and set the thresholdDays attribute to the number of days beyond which you want data to be dropped. These changes will take effect on restart.