LogShark Workbook - ART (Vizqlserver Activity and Resource Tracing)
In this section:
- What is it?
- Glossary of Important Terms to Understand ART Workbook Data and Dashboards
- When to use it?
- Activity Naming Conventions
- Memory Tracking
- Accuracy
- CPU Thread Time Tracking
- Dashboards
- Net New Memory
What is it?
The ART workbook is built from Vizqlserver Activity and Resource Tracing (ART) logging. The ART logging captures CPU and memory utilization for each vizqlserver activity as well as the sponsorship and depth of the activitties and additional contextual metadata about the activity.
Note: Many of the views in the workbook make use of additional fields that were added to the ART logging in the 2018.3 release. For Servers on versions prior to 2018.3 some functionality in the dashboards may be missing(Such as the ability to identify the different request Types
Glossary of Important Terms to Understand ART Workbook Data and Dashboards
- Inclusive Vs Exclusive Resource Usage: ART Resource usage is tracked for each activity as inclusive and exclusive resource usage. The Inclusive resource usage shows the memory/CPU utilization for the activity plus all sponsee or child activities that are called by the activity. The Exclusive resource usage shows only the memory/CPU utilization for the specific activity and excludes the sponsee or child activities.
- Sponsorship: The request is given a Root Unique ID and then each activity that is called for the request will be the sponsee of the Sponsor activity that called the activity. The sponsor-Sponsee relationship of activities can also be thought of as a parent child relationship. Every activity which is not the root always can identify two other nodes in the tree: its direct parent (sponsor) and the root.
- Depth: The request will be at Depth 0 and each sponsee called by a sponsor activity will increase the depth by 1 so the Depth is used to show the depth of the chain of Sponsor-Sponsee activities.
When to use it?
- Identify resource intensive requests in cases of high CPU/memory usage by the Vizqlserver process
- Get an idea of the total number of vizqlserver requests being made and what type of requests are accounting for the majority of the activity
- For resource intensive requests investigate which components and activities in the request account for the bulk of the resource usage
- For long running requests investigate which components and activities account for the bulk of the time spent
- Identify requests that error and see which component and activity had the error and what the error text was
- Comparing loads of the same dashboard to identify where additional time is spent on slower loads
Activity Naming Conventions
component-name.activity-name[.activity-name ...]
- component-name: the name of the unit that logically groups together related activities. Everything up to the first dot is the component-name.
- activity-name: the name of the functional unit of work. Everything after the first dot is the activity-name.
Memory Tracking
Activity memory tracking statistics include bytes allocated and deallocated, and the number of times allocations and deallocations occurred.
When an Activity begins, a MemoryScope object is pushed onto a stack of MemoryScopes in Thread-Local Storage (TLS). Memory allocations and deallocations on that thread will update values in the stack of MemoryScopes. When an Activity ends, its MemoryScope is popped out of TLS.
Accuracy
- Windows: It is accurate to the extent that heap use occurs in a module linked to tabmemory; in other words, any untracked modules represent blind spots.
- Linux: Linux should provide greater accuracy because the overrides are seen process wide.
CPU Thread Time Tracking
CPU Thread Time tracking provides separate values for user and kernel time in Linux while Windows only uses User Time. Thread Time is reported in units of milliseconds, and includes a count of the number of threads involved. It represents the amount of time an Activity ran on a processor/core. Time units are normalized across different platforms/processors.
Dashboards
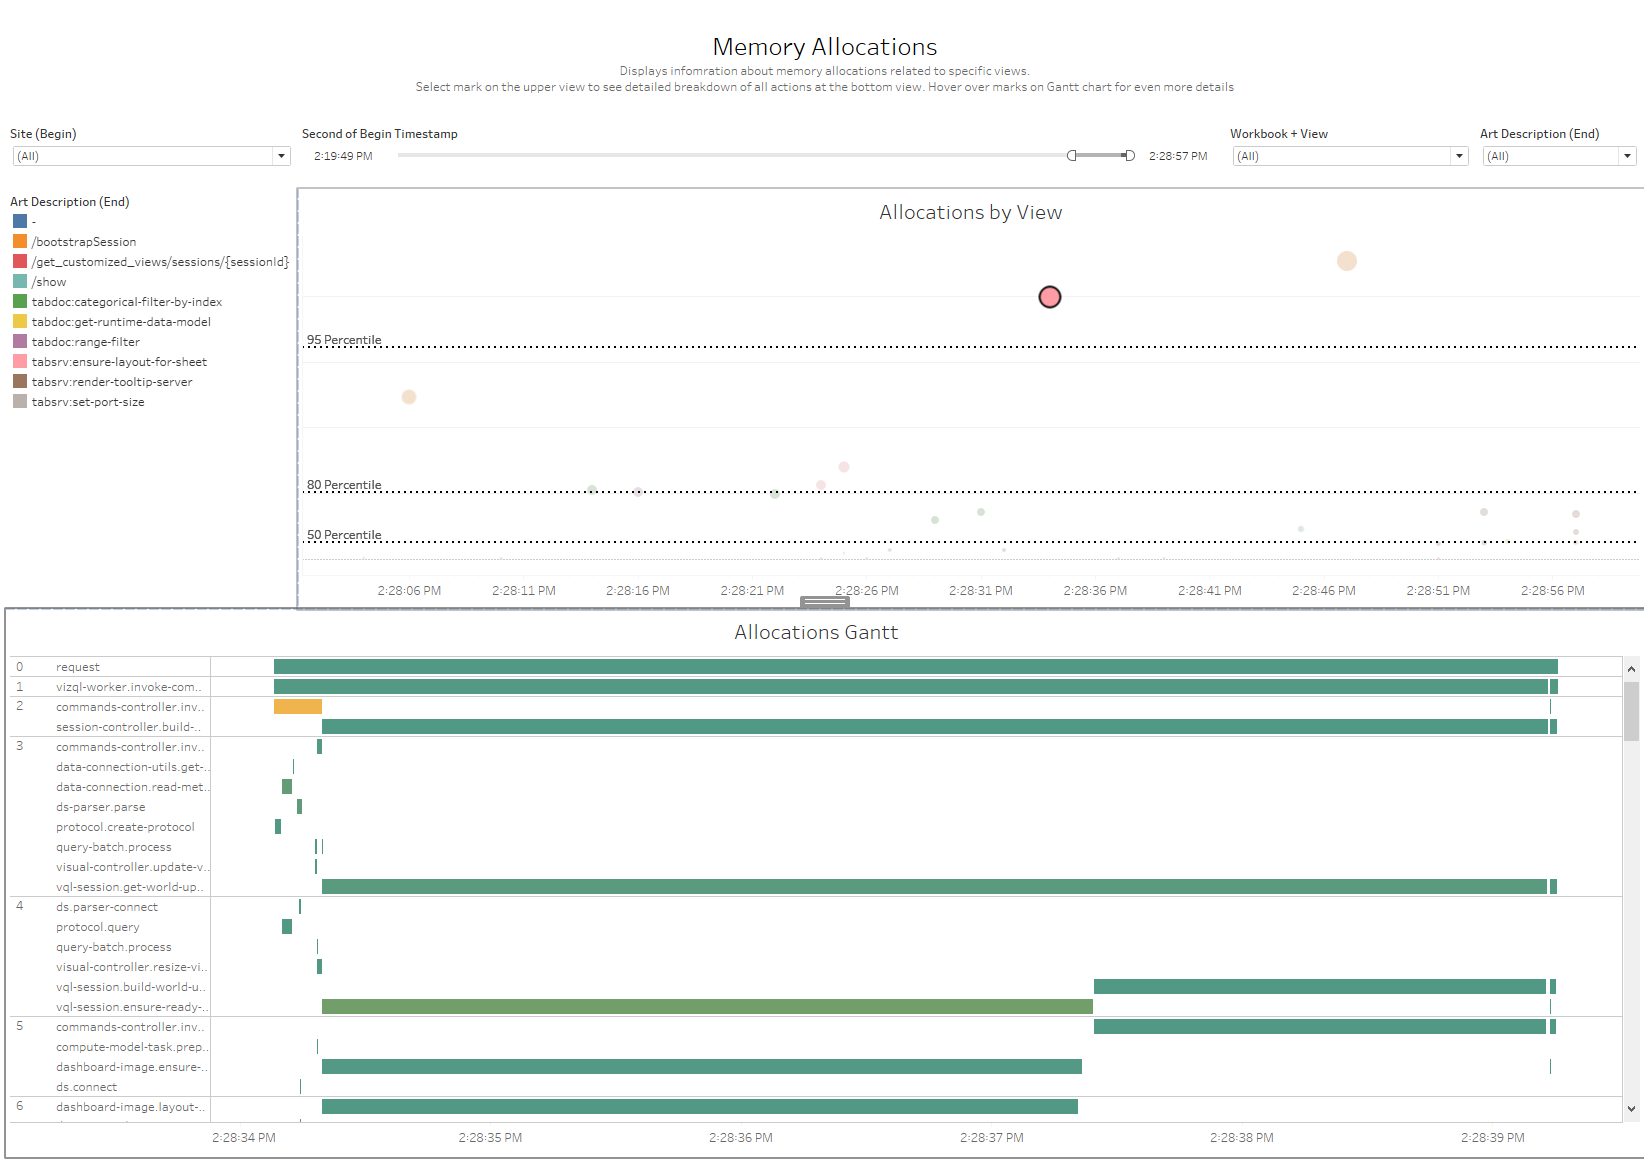
Memory Allocations
Views:
- Allocations by View This sheet is a plot with Time of the request on the X axis and size of
inclusive allocations on the Y axis
- Color: Colored by request description type(I.E. Bootstrap, Categorical filter, etc.)
- Mark Size: Size of inclusive allocations for the request
- Allocations Gantt This sheet is a depth flame chart with Timestamp on the Column and ART Depth and
Activity name on the rows
- Mark Size: Gantt bars sized based on elapsed time
- Mark Color: Gantt bars colored on exclusive allocation bytes for the activity
Quick Filters:
- Site Dropdown The Site dropdown filter can be used to show only requests from a specific site
- Begin Timestamp range filter The begin timestamp range filter can be used to filter to requests that started in a specific range of time
- Workbook+View Dropdown to filter to requests for a specific Workbook and View
- Art Description Dropdown To filter to specific request types
Selection Filters:
- Select any mark in the plot view to populate the Allocations flame chart with the requests activities
Notes: If you are investigating Vizqlserver high memory usage issues having the customer gather Perfmon data using the template on our ‘Perfmon for customers’ page will help narrow down to the specific time the memory spikes and allow you to narrow the timeframe you are looking at in the dashboard
Use Cases:
- Identify requests that are causing high vizqlserver memory usage
- For high memory usage requests the allocations gantt will be useful to identify which component and activity are allocating most of the memory
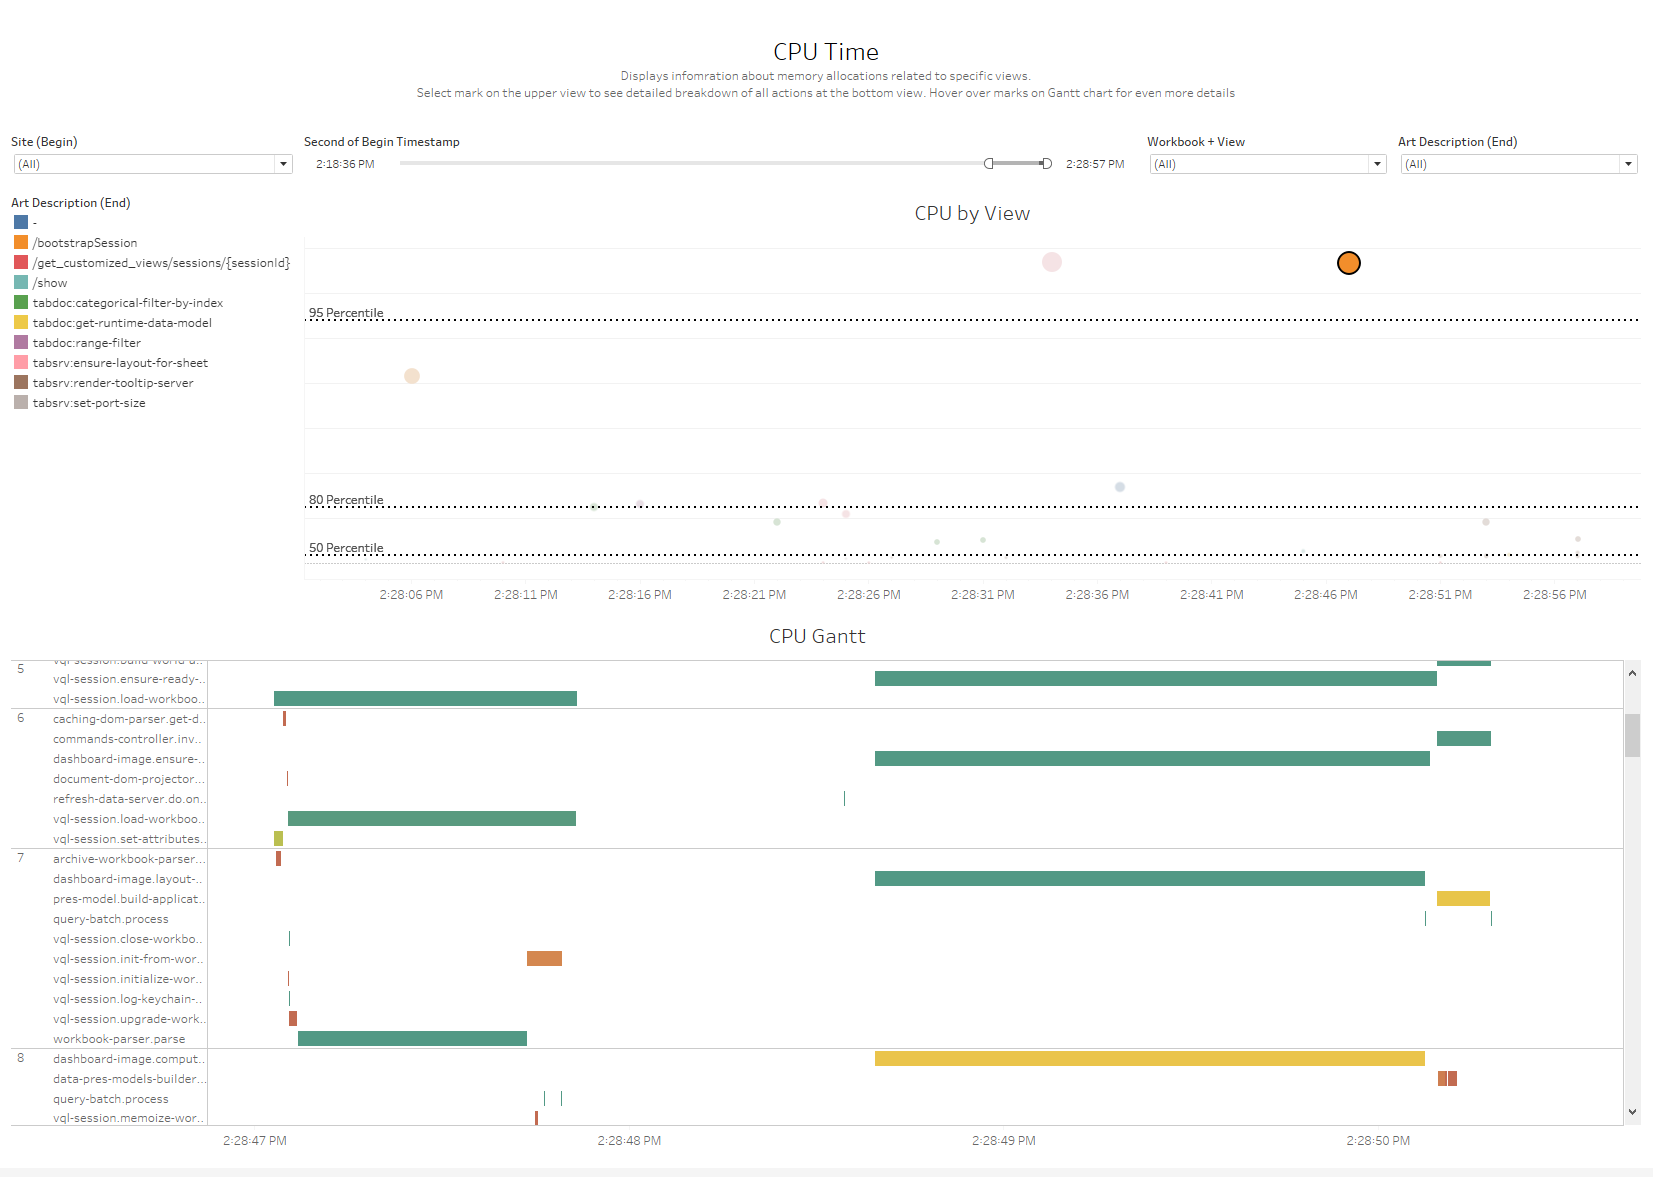
CPU Time
Views:
- CPU by View This sheet is a plot with Time of the request on the X axis and Inclusive CPU time on the Y axis
- Color: Colored by request description type(I.E. Bootstrap, Categorical filter, etc.)
- Mark Size: Size based on Inclusive CPU time for request
- CPU Gantt This sheet is a depth flame chart with Timestamp on the Column and ART Depth and Activity name on the rows
- Mark Size: Gantt bars sized based on elapsed time
- Mark Color: Gantt bars colored on Exclusive CPU utilization percentage for activity
Quick Filters:
- Site Dropdown The Site dropdown filter can be used to show only requests from a specific site
- Begin Timestamp range filter The begin timestamp range filter can be used to filter to requests that started in a specific range of time
- Workbook+View Dropdown to filter to requests for a specific Workbook and View
- Art Description Dropdown To filter to specific request types
Selection Filters:
- Select any mark in the plot view to populate the CPU flame chart with the requests activities
Notes:
- If you are investigating Vizqlserver high CPU usage issues having the customer gather Perfmon data using the template on our ‘Perfmon for customers’ page will help narrow down to the specific time the memory spikes and allow you to narrow the timeframe you are looking at in the dashboard
Use Cases:
- Identify requests that are causing high vizqlserver memory usage
- For high memory usage requests the allocations gantt will be useful to identify which component and activity are allocating most of the memory
Compare Sessions
Views:
- Request Time Plot A plot of the vizqlserver requests with the begin timestamp on the X axis and the Art elapsed time on the Y axis.
- Color: Colored by request description type(I.E. Bootstrap, Categorical filter, etc.)
- Number of Requests by Type: This sheet shows the number of requests for each dashboard for the selected Request type
- Session Comparison Flamecharts: This view shows flamecharts for each selected request in the plot graph. The metrics used for the flamechart will be based on the parameter selection
- Session Comparison Bar Chart: A stacked bar chart that shows the activities for the selected requests the number of times the activity was executed and the wall clock time, inclusive CPU or Exclusive CPU (Depending on the Parameter selection). If Cache Comparison is selected on the ‘Comparison Type’ parameter this will show the number of cache hits and misses for each cache for the selected requests
- Color: Depends on the parameter selection
- Sort: Depends on the Parameter Selection
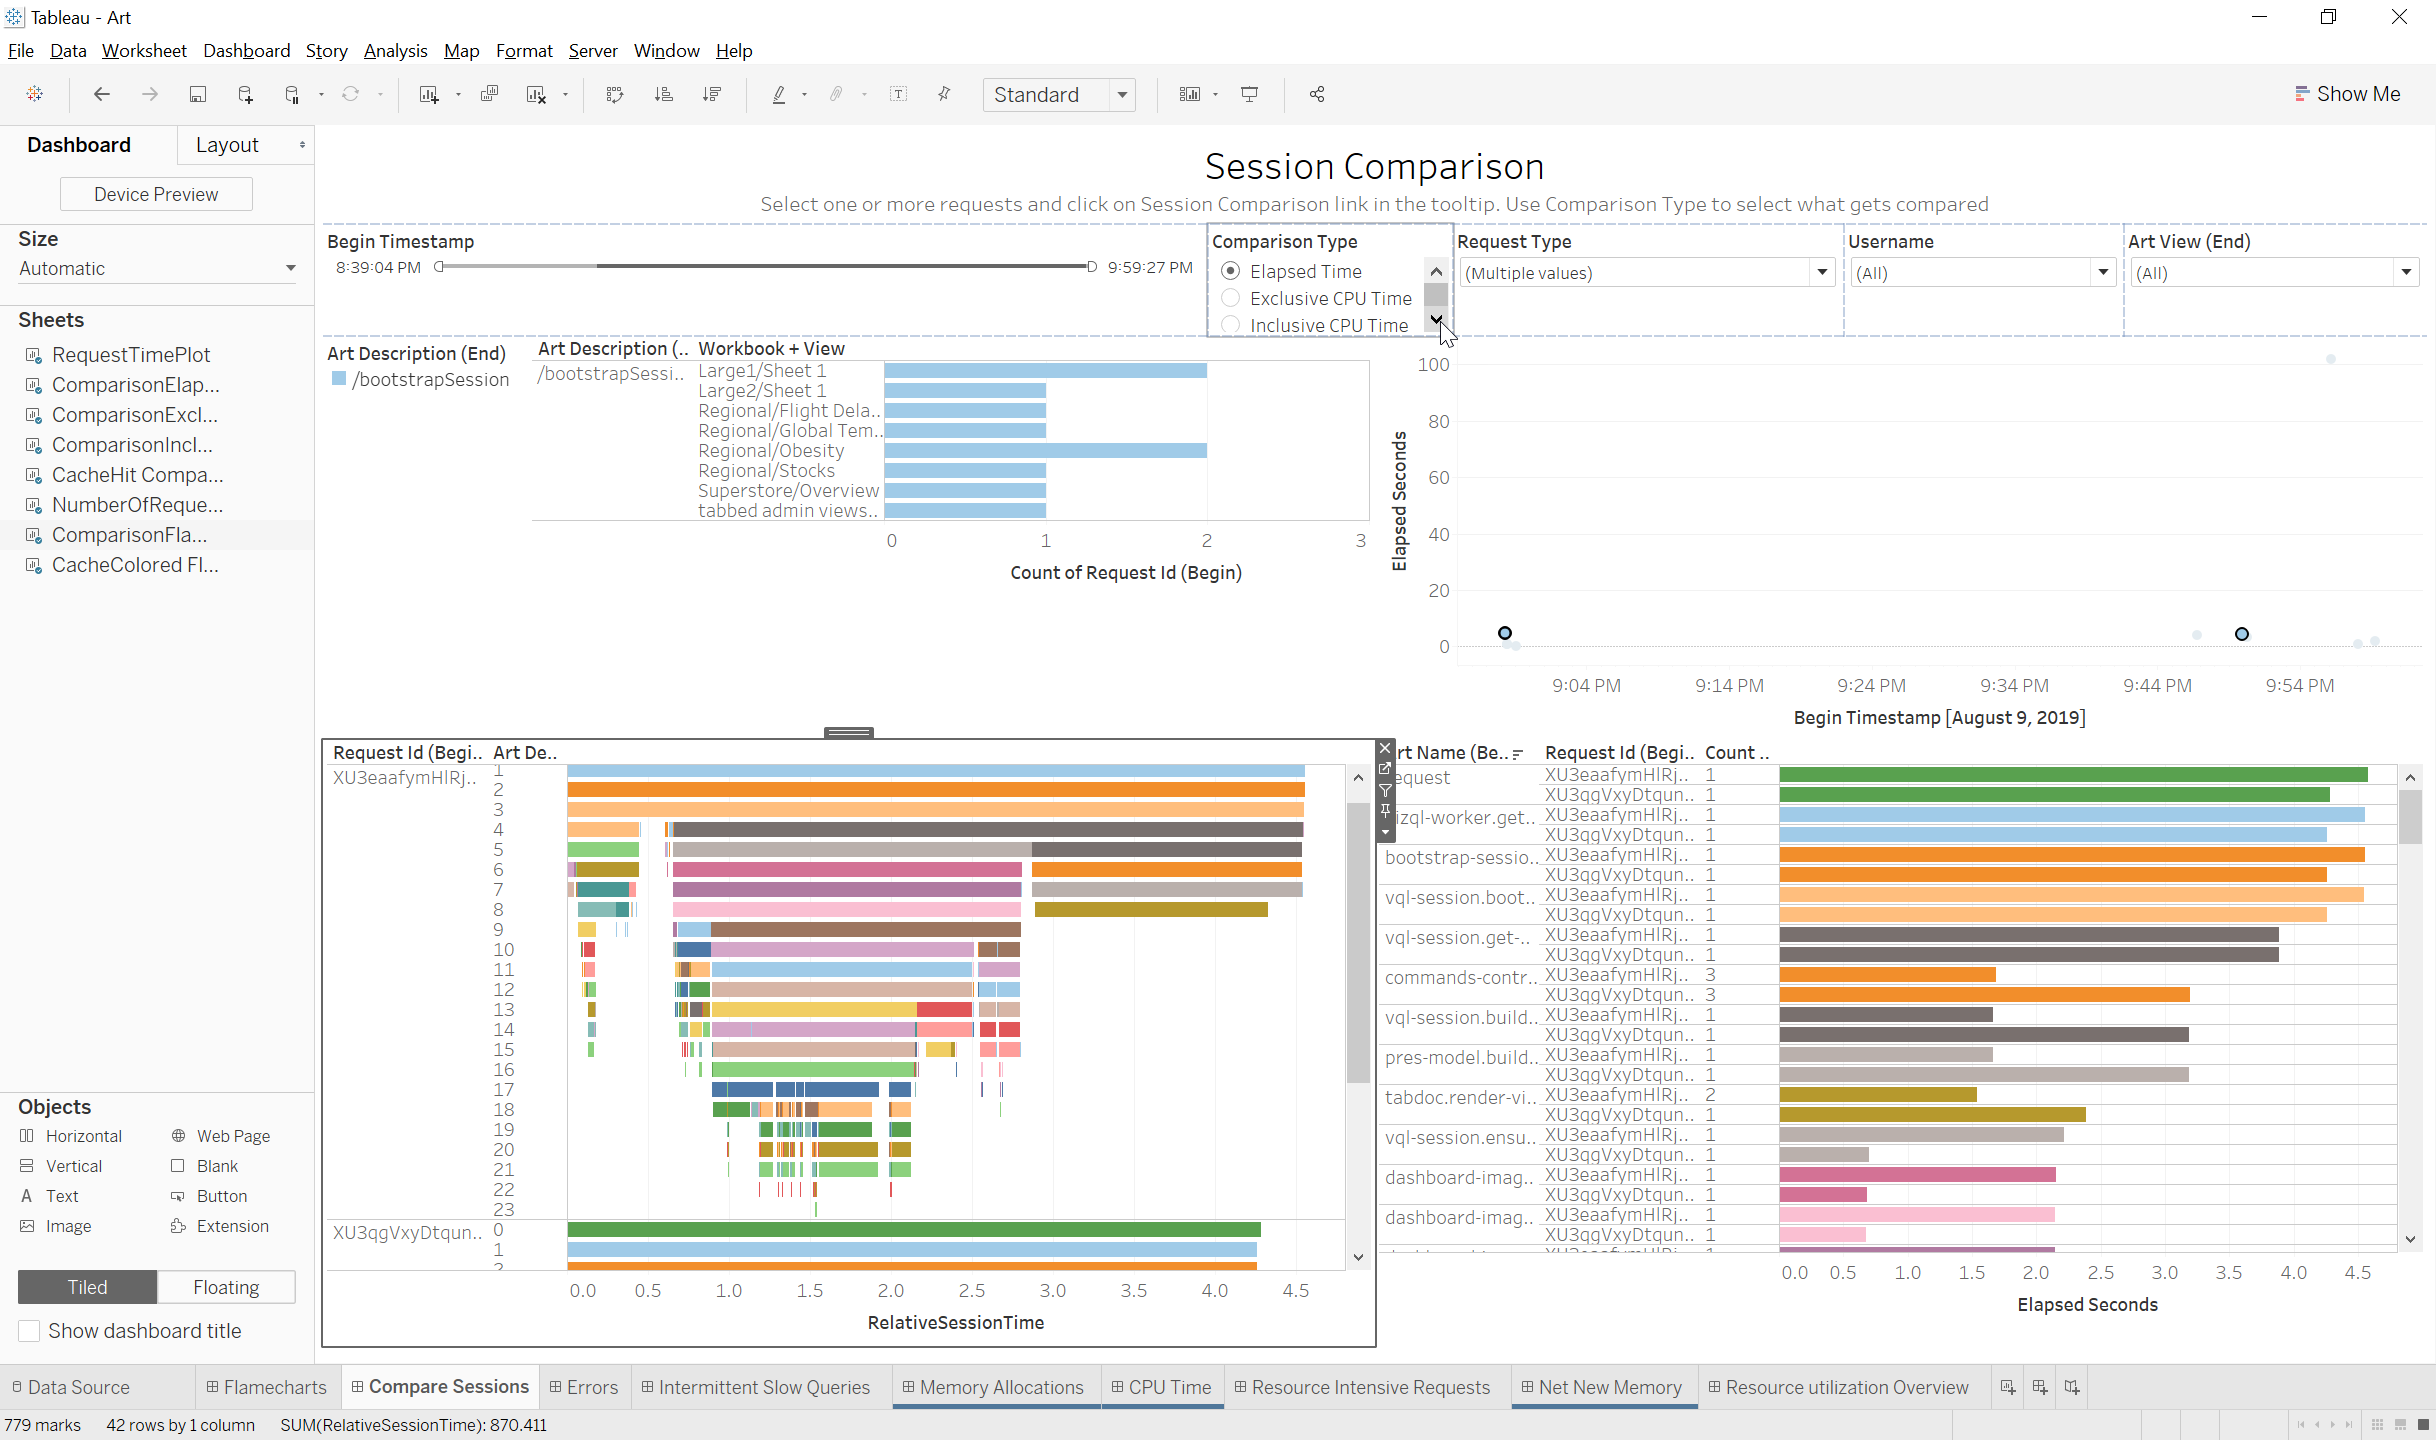
Parameter Selection:
- Comparison Type: This parameter decides the metrics that will be used for the flamechart and bar chart for the selected requests
- Elapsed Time: This will show the wall clock time for the activities in the flamechart and the bar chart
- Inclusive CPU Time: This will show the CPU time spent for each activity including all sponsee activities called by the activity. Inclusive CPU Time is useful to identify the high level activities that called the expensive sponsee activities
- Exclusive CPU TIme: Exclusive CPU Time will show the CPU time spent for each activity excluding the CPU Time from sponsee activities
- Cache Hits: This will show the cache hits and misses for each cache for the selected requests
Quick Filters:
- Art Description Dropdown To filter to specific request types
- Art Workbook Dropdown To filter to requests related to a specific Workbook
- Art View Dropdown Relevant values filter to filter to requests related to a specific view(If a specific workbook is selected this will only show views for that workbook)
- Username Dropdown to filter to requests that come from a specific user
- Begin Timestamp range filter The begin timestamp range filter can be used to filter to requests that started in a specific range of time
Selection Filters:
- Session Comparison Hold control and select multiple marks in the plot and then select the Session Comparison action filter in the tooltip to populate the SessionComparison view with the requests you would like to compare
Notes:
- If you are investigating why a specific Dashboard/View sometimes loads significantly slower than other loads then it is a good idea to filter down to requests from a specific user to compare like sessions in case there is user filtering being used on the dashboard
Use Cases:
- Compare a slow and fast load or action for the same workbook to see where the additional time is spent in the slow session
- The Count of activities can be used to verify whether the same number of activities(such as Queries and Sheet updates) are occurring for the slow and fast session
- The Cache hits ‘Comparison Type’ is useful to look at the cache behavior for different loads and see if the difference between a slow and fast load of the same dashboard was due to differences in cache utilization
Flamecharts
Views:
- RequestTimePlotComponent A plot of the vizqlserver requests with the begin timestamp on the X axis and the Art elapsed time on the Y axis.
- Color: Colored by request description type(I.E. Bootstrap, Categorical filter, etc.)
- Component Colored FlameChart The component colored flame chart is a Gantt chart that creates a flame graph based on the Art activities and their depths.
- Color: The activities are colored based on the Art name
- Size: The Gantt bars for each activity begin at the activity begin timestamp and the length is determined by the Art elapsed time
- CPU Colored Flamechart The CPU colored flame chart is a Gantt chart that creates a flame graph based on the Art activities and their depths.
- Color: The activities are colored based on the exclusive CPU percentage of a core used by each activity
- Size: The Gantt bars for each activity begin at the activity begin timestamp and the length is determined by the Art elapsed time
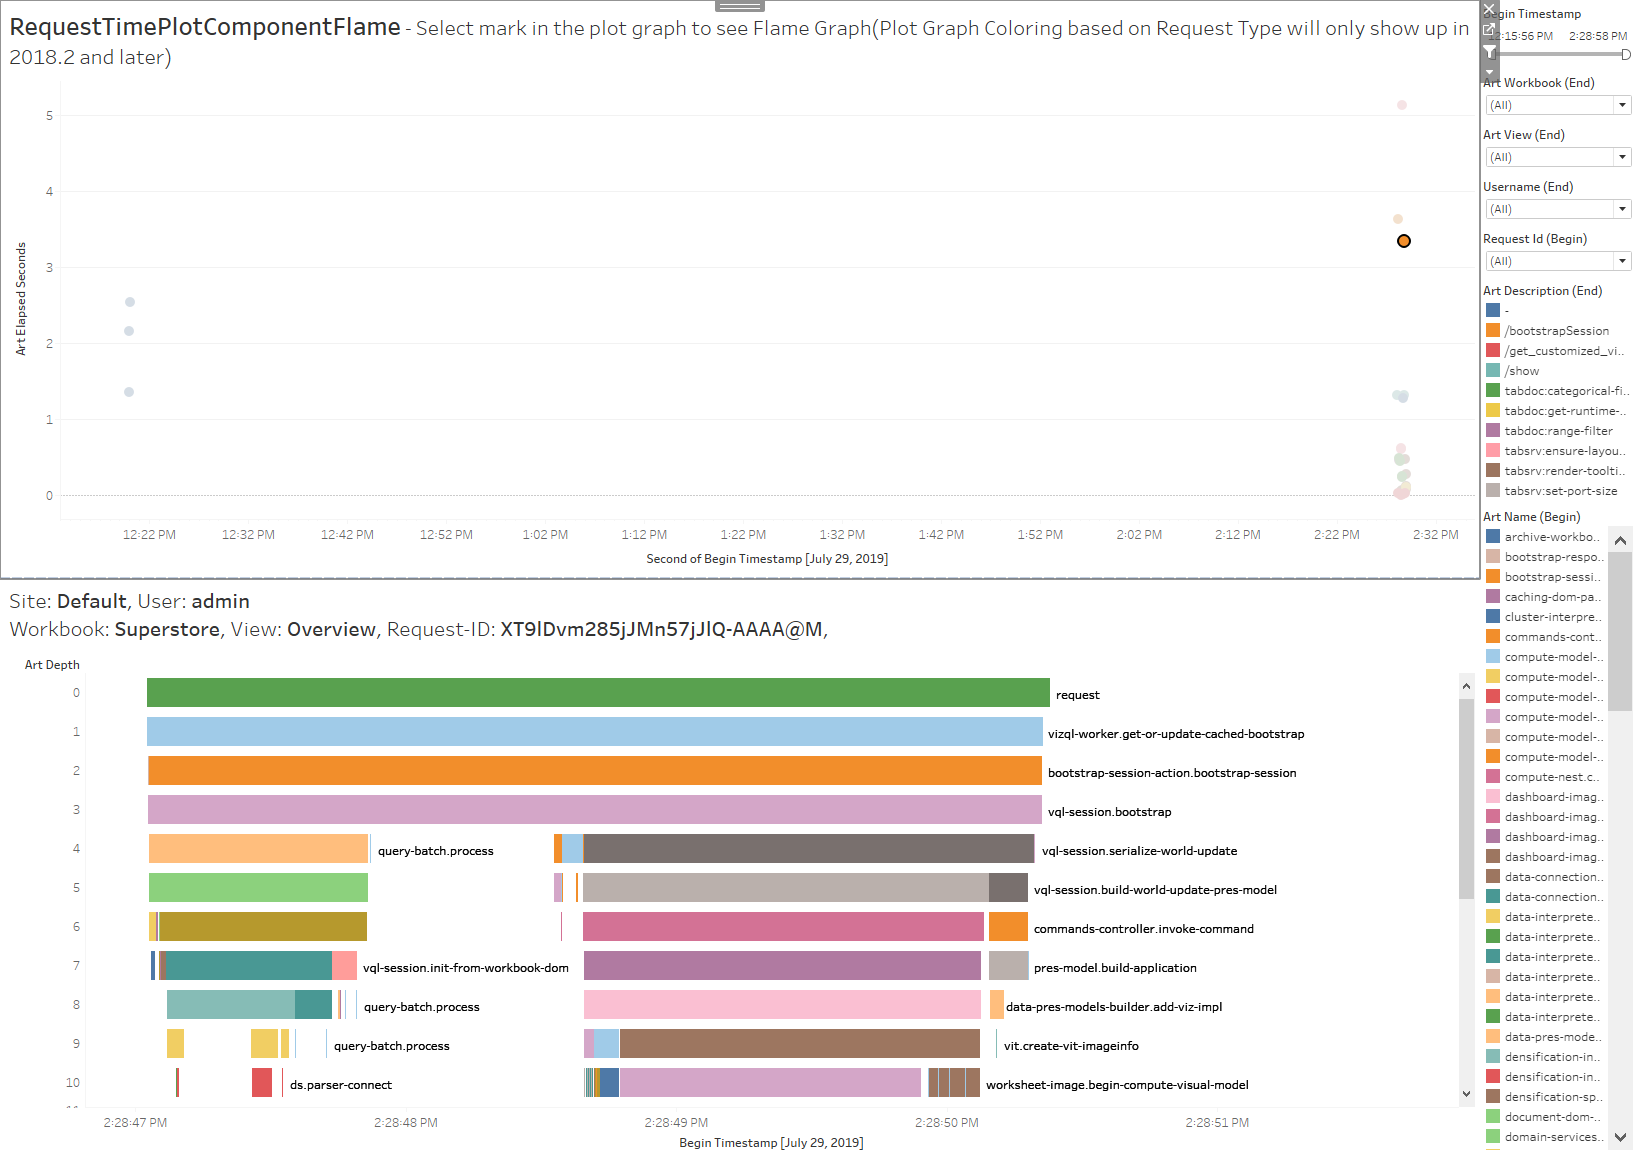
Parameter Selection:
- Flamechart Type: The flamechart type parameter selection switches the coloring for the flamecharts
- CPU Flamechart: Activities on the flamechart will be colored based on exclusive CPU usage for each activity
- Component Flamechart: Flamechart is colored based on the Component-Activity
Quick Filters:
- Art Description Dropdown To filter to specific request types
- Art Workbook Dropdown To filter to requests related to a specific Workbook
- Art View Dropdown Relevant values filter to filter to requests related to a specific view(If a specific workbook is selected this will only show views for that workbook)
- Username Dropdown to filter to requests that come from a specific user
- Begin Timestamp range filter The begin timestamp range filter can be used to filter to requests that started in a specific range of time
Selection Filters:
- Selecting any mark in the plot view will bring up the Component colored flamechart for the selected request
Use Cases:
- The Component colored flame graphs are a great way to get a quick and detailed overview of the component-activity sponsorship, all of the activities that are called in processing the request and where the time is spent in the request
- The CPU flamechart gives A useful overview of the request activities exclusive CPU usage that can be used to quickly identify which activities have the highest CPU usage
Intermittent Slow Queries
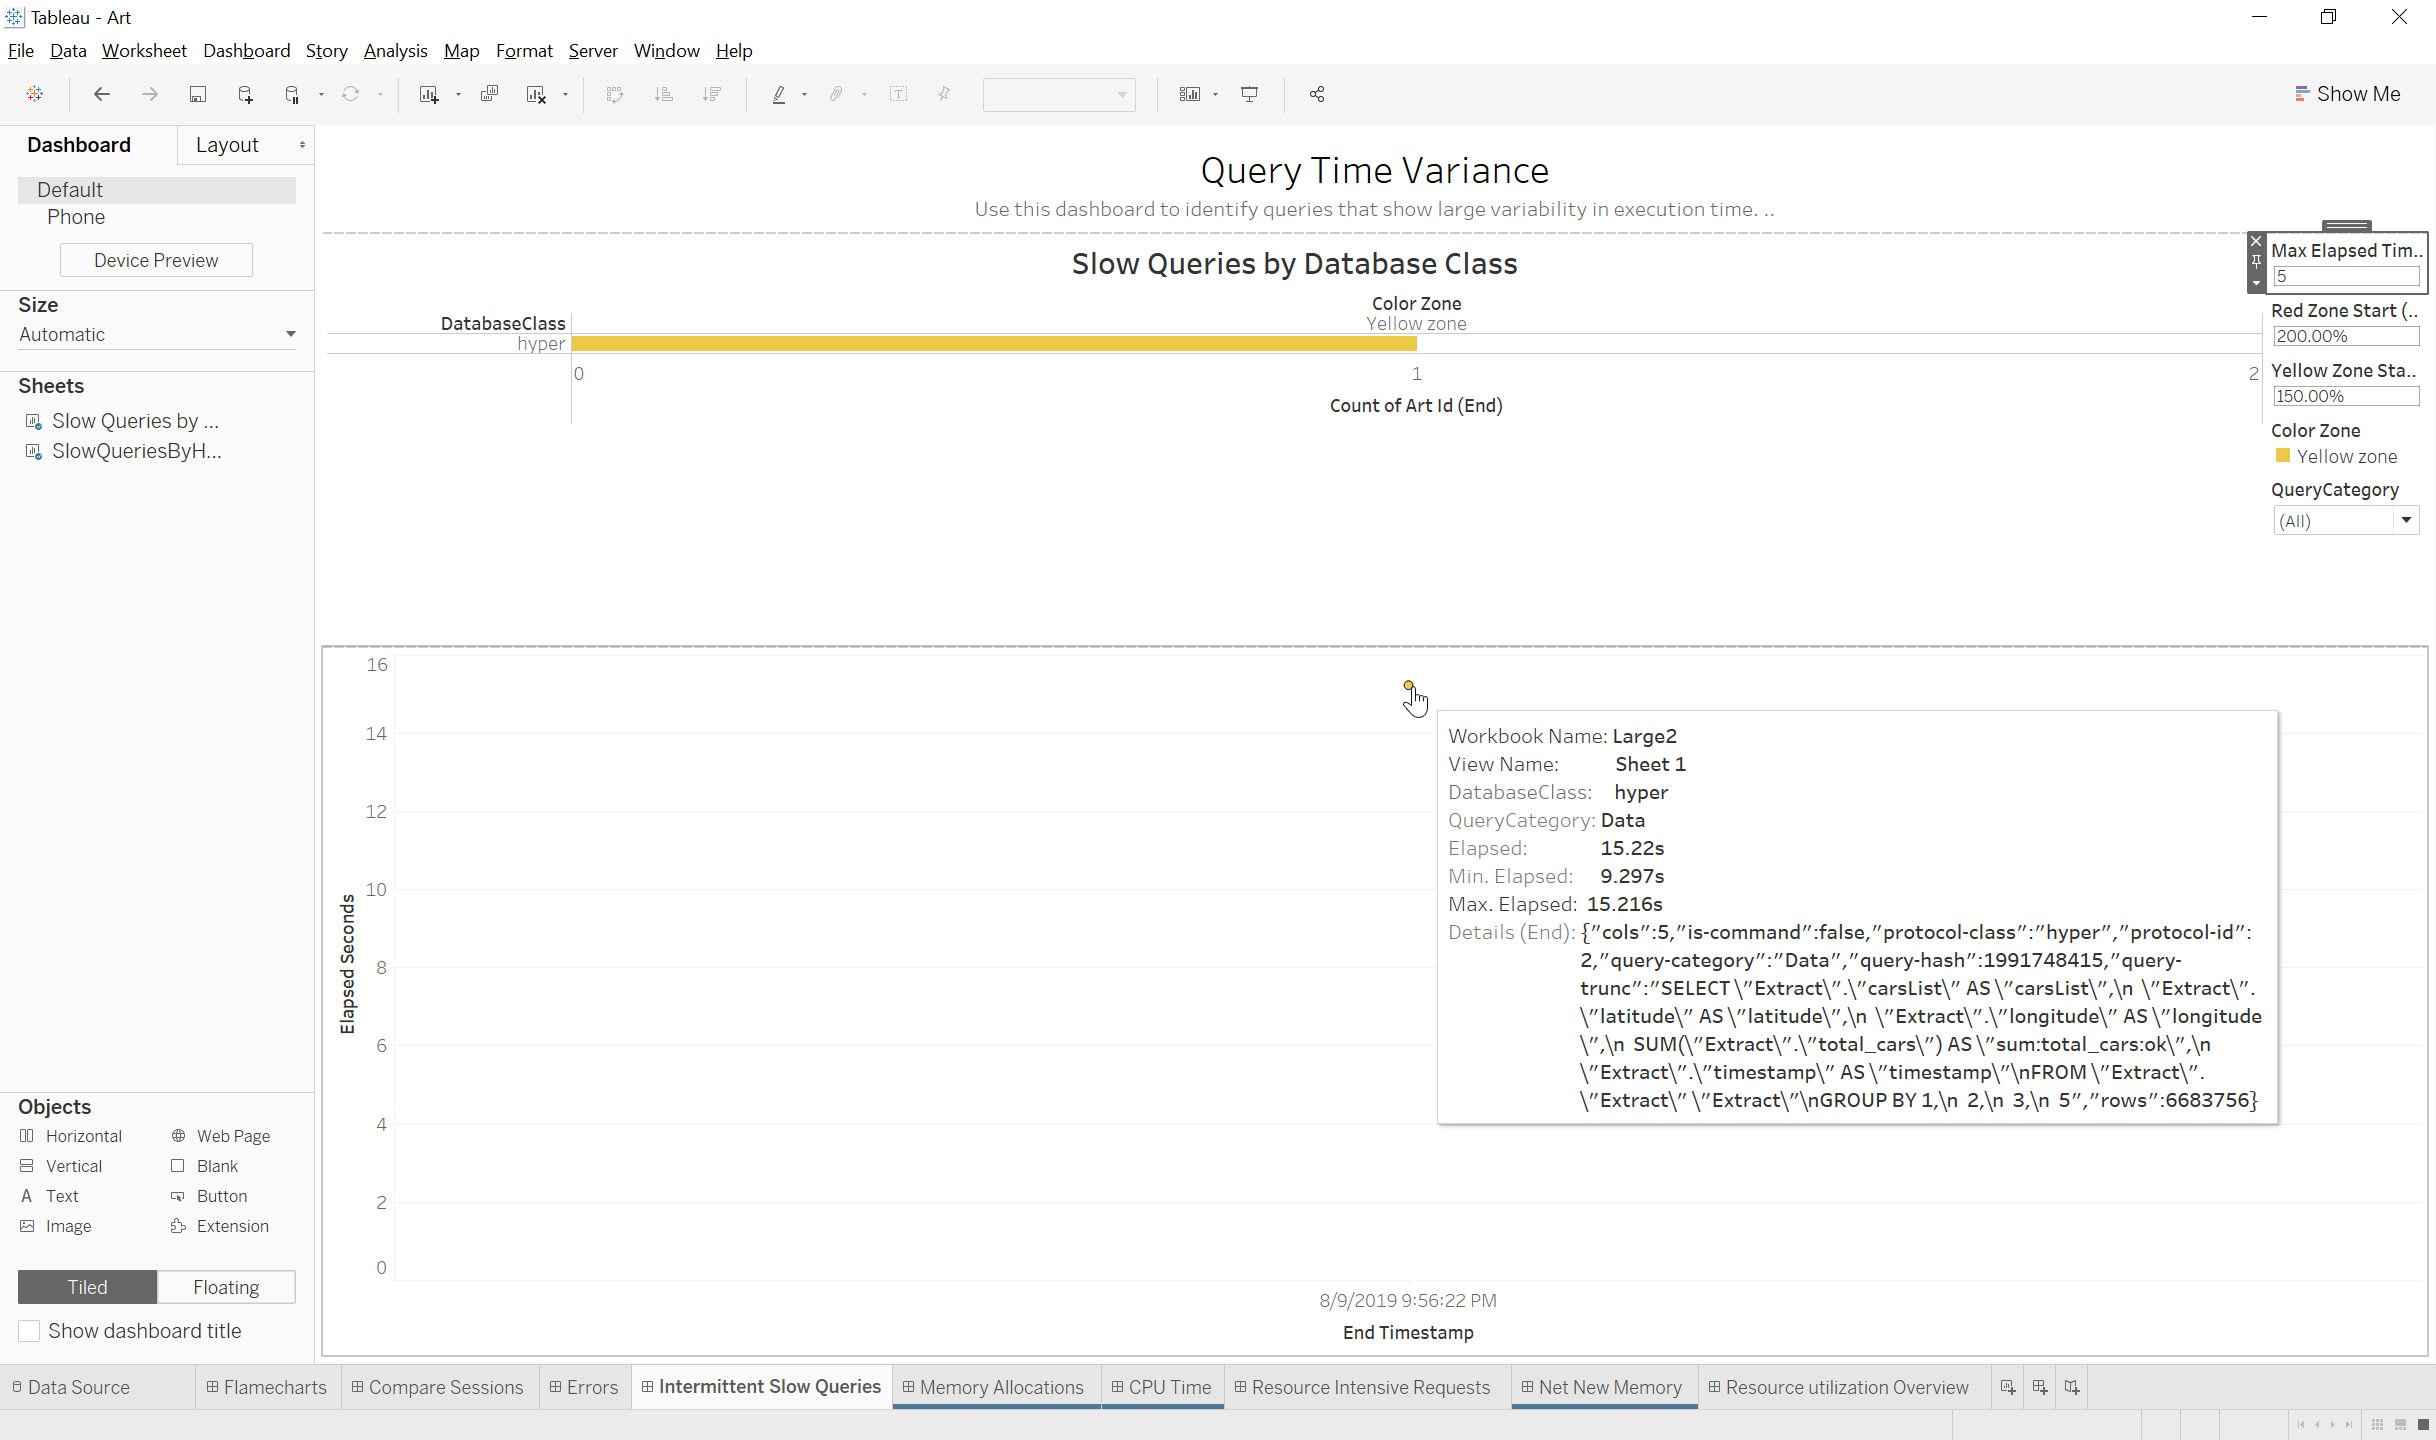
Views:
- Slow Queries By Database Class: This view shows the number of queries for each database class that took 150%/200% longer than the fastest run of the query
- Color: Yellow is queries that were between 150-200% of the fastest execution time and red is queries that were over 200% of the fastest execution.
- SlowQueriesByHash: This view is a plot graph of the slow queries with the End timestamp on the X axis and the Elapsed Time for the query on the Y axis
- Color: Same as the Slow Queries By Database Class coloring
Quick Filters:
- Query Category: Thie query category filter allows you to filter down to specific categories of queries(IFor Example: Metadata, Domain)
Selection Filters:
- Selecting any mark in the plot view will bring up the Component colored flamechart for the selected reques
Parameters:
- Max Elapsed Time >: This parameter sets the elapsed seconds threshold that a query-hash must exceed to be shown
- Red Zone Start (%): This parameter determines how much longer the execution must be compared to the fastest execution of the query-hash in order to be colored red
- Yellow Zone Start (%): This parameter determines how much longer the execution must be compared to the fastest execution of the query-hash in order to be colored yellow
Notes:
- Every query that is run is assigned a query-hash based on the query context. If the query-hash for two queries match then they are the same query and returned the same number of results. For this dashboard we use the query-hashes to identify times that the same query-hash took 150%/200% longer to execute than the fastest execution for that query-hash
- For queries that list ‘Sqlproxy’ as the database Class, those are published datasources and you will need to check the dataserver logs to see the actual database class type. We will be updating the workbook in the future to include the Dataserver ART logging
Use Cases:
- Helpful for identifying times where view performance degrades due to slower execution of queries sent oto the database.
- There are a couple main causes of intermittent performance degradation of query execution time:
- Environmental issues such as memory/CPU exhaustion or Antivirus processes/drivers interfering with Tableau Server processes
- Increased network latency
- Slowdowns on the Database side
- If the queries are ‘Hyper’ database class the Hyper processes may be over-saturated at the time due to a large number of jobs or expensive long running queries that are tying up the Hyper threads
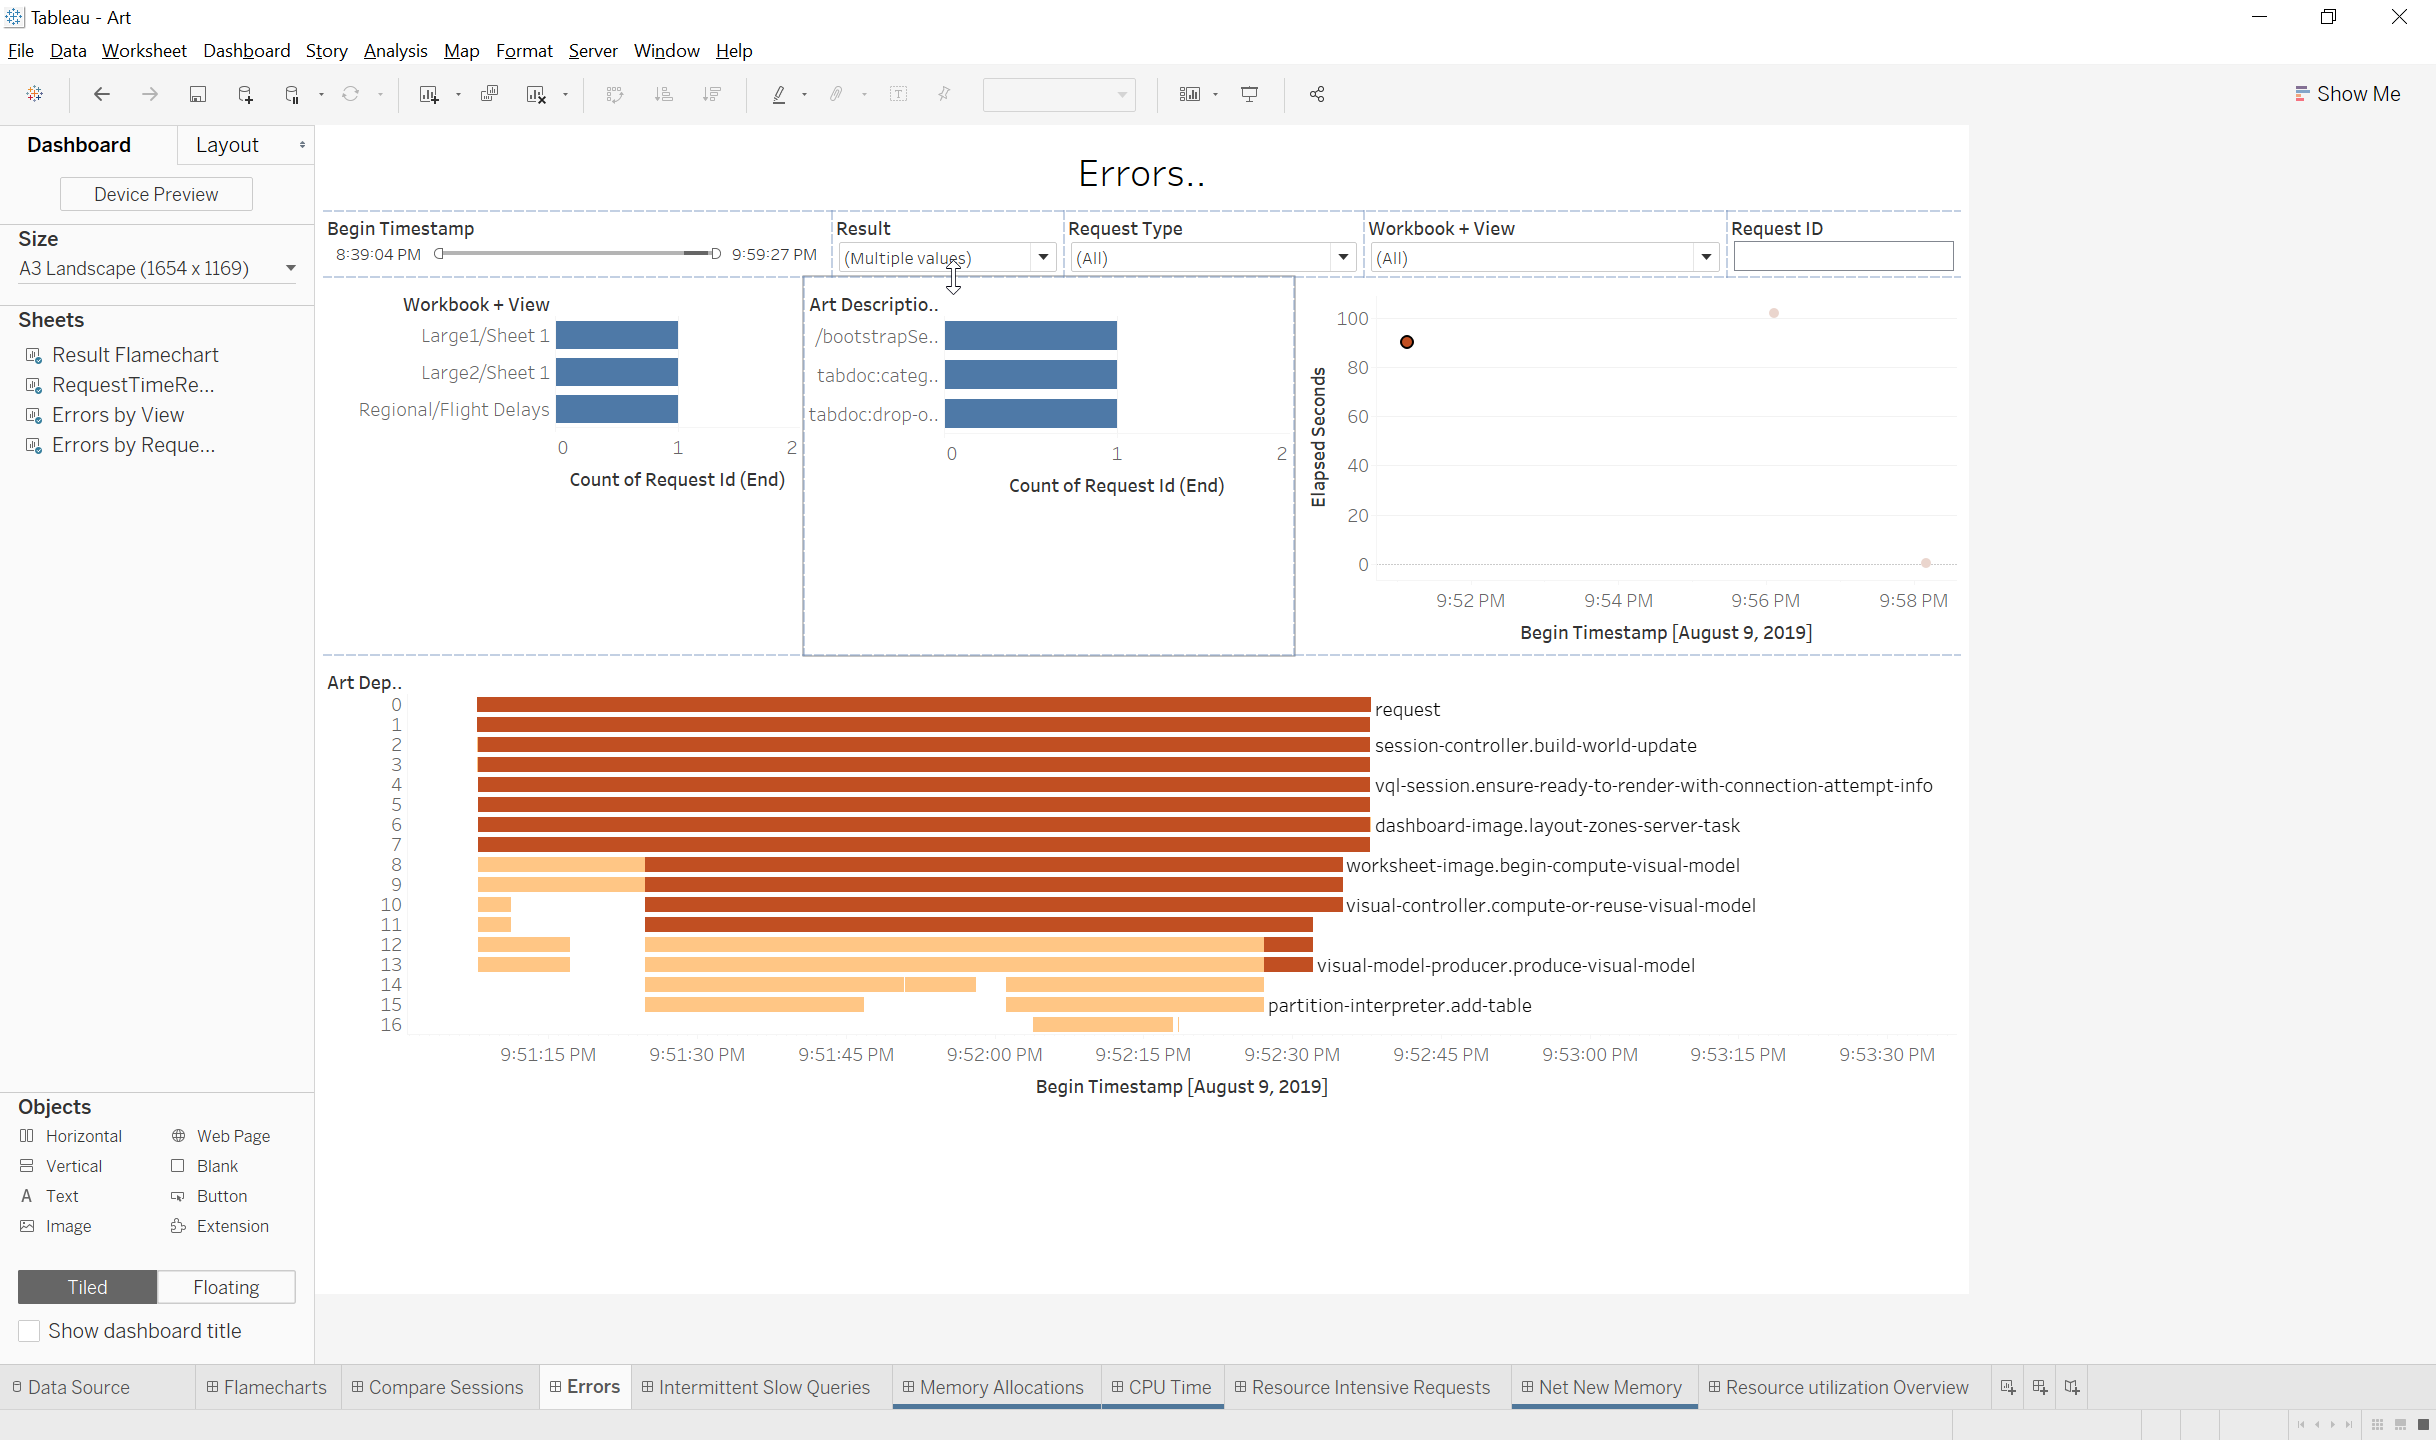
Errors
Views:
- Errors by View: Shows the number of requests with errors for each Workbook+View
- Errors by Request-Type: Shows the number of requests with errors broken down by Request-type which includes Initial View Load(Bootstrapsession) and interactions with the workbook such as Filter selections.
- RequestTimeResultFlame: A plot graph of the requests with errors with the Begin Timestamp for the request on the X axis and the Elapsed time for the request on the Y Axis
- Result Colored Flamechart The result colored flame chart is a Gantt chart that creates a flame graph based on the Art activities and their depths.
- Color: The activities are colored based on the result returned for each activity in the request(‘ok’,’Error’ etc)
- Size: The Gantt bars for each activity begin at the activity begin timestamp and the length is determined by the Art elapsed time
Quick Filters:
- Request Type Dropdown That can be used to filter to just bootstrapsession or specific interaction requests
- Result Dropdown To filter to specific Result-key
- Workbook+view Dropdown To only show error requests for a specific dashboard
- Request ID Wildcard Filter This will be useful if you have picked out a failed request from the Apache workbook and want to quickly filter to the request-ID
- Begin Timestamp range filter The begin timestamp range filter can be used to filter to requests that started in a specific range of time
Notes:
- These are the possible Result-keys and what they signify:
- ok: the activity reported no errors (the default)
- Error: An ‘error’ result on the Request(Depth 0) shows that there are exceptions in sponsee activities at lower depths
- exception: an exception that caused abnormal termination of the activity, but impact (intolerable vs tolerable) is uncertain.
- early-termination: something caused the activity to terminate early, such as an exception in the request or user-cancel
- Result-Value(RV): The result value for ‘Error’ and ‘Early-Terimation’ activities will have generic error messages but the activities with ‘Exception’ result should show useful text about the exception in the RV field
- Exceptions can be tolerable or intolerable so requests with exceptions may still complete successfully
Use Cases:
- Identify requests that have ‘early terminations’, ‘errors’ or exceptions
- Use the Error flamegraph to easily identify the Activity that had the Error or abnormal termination and view the error message
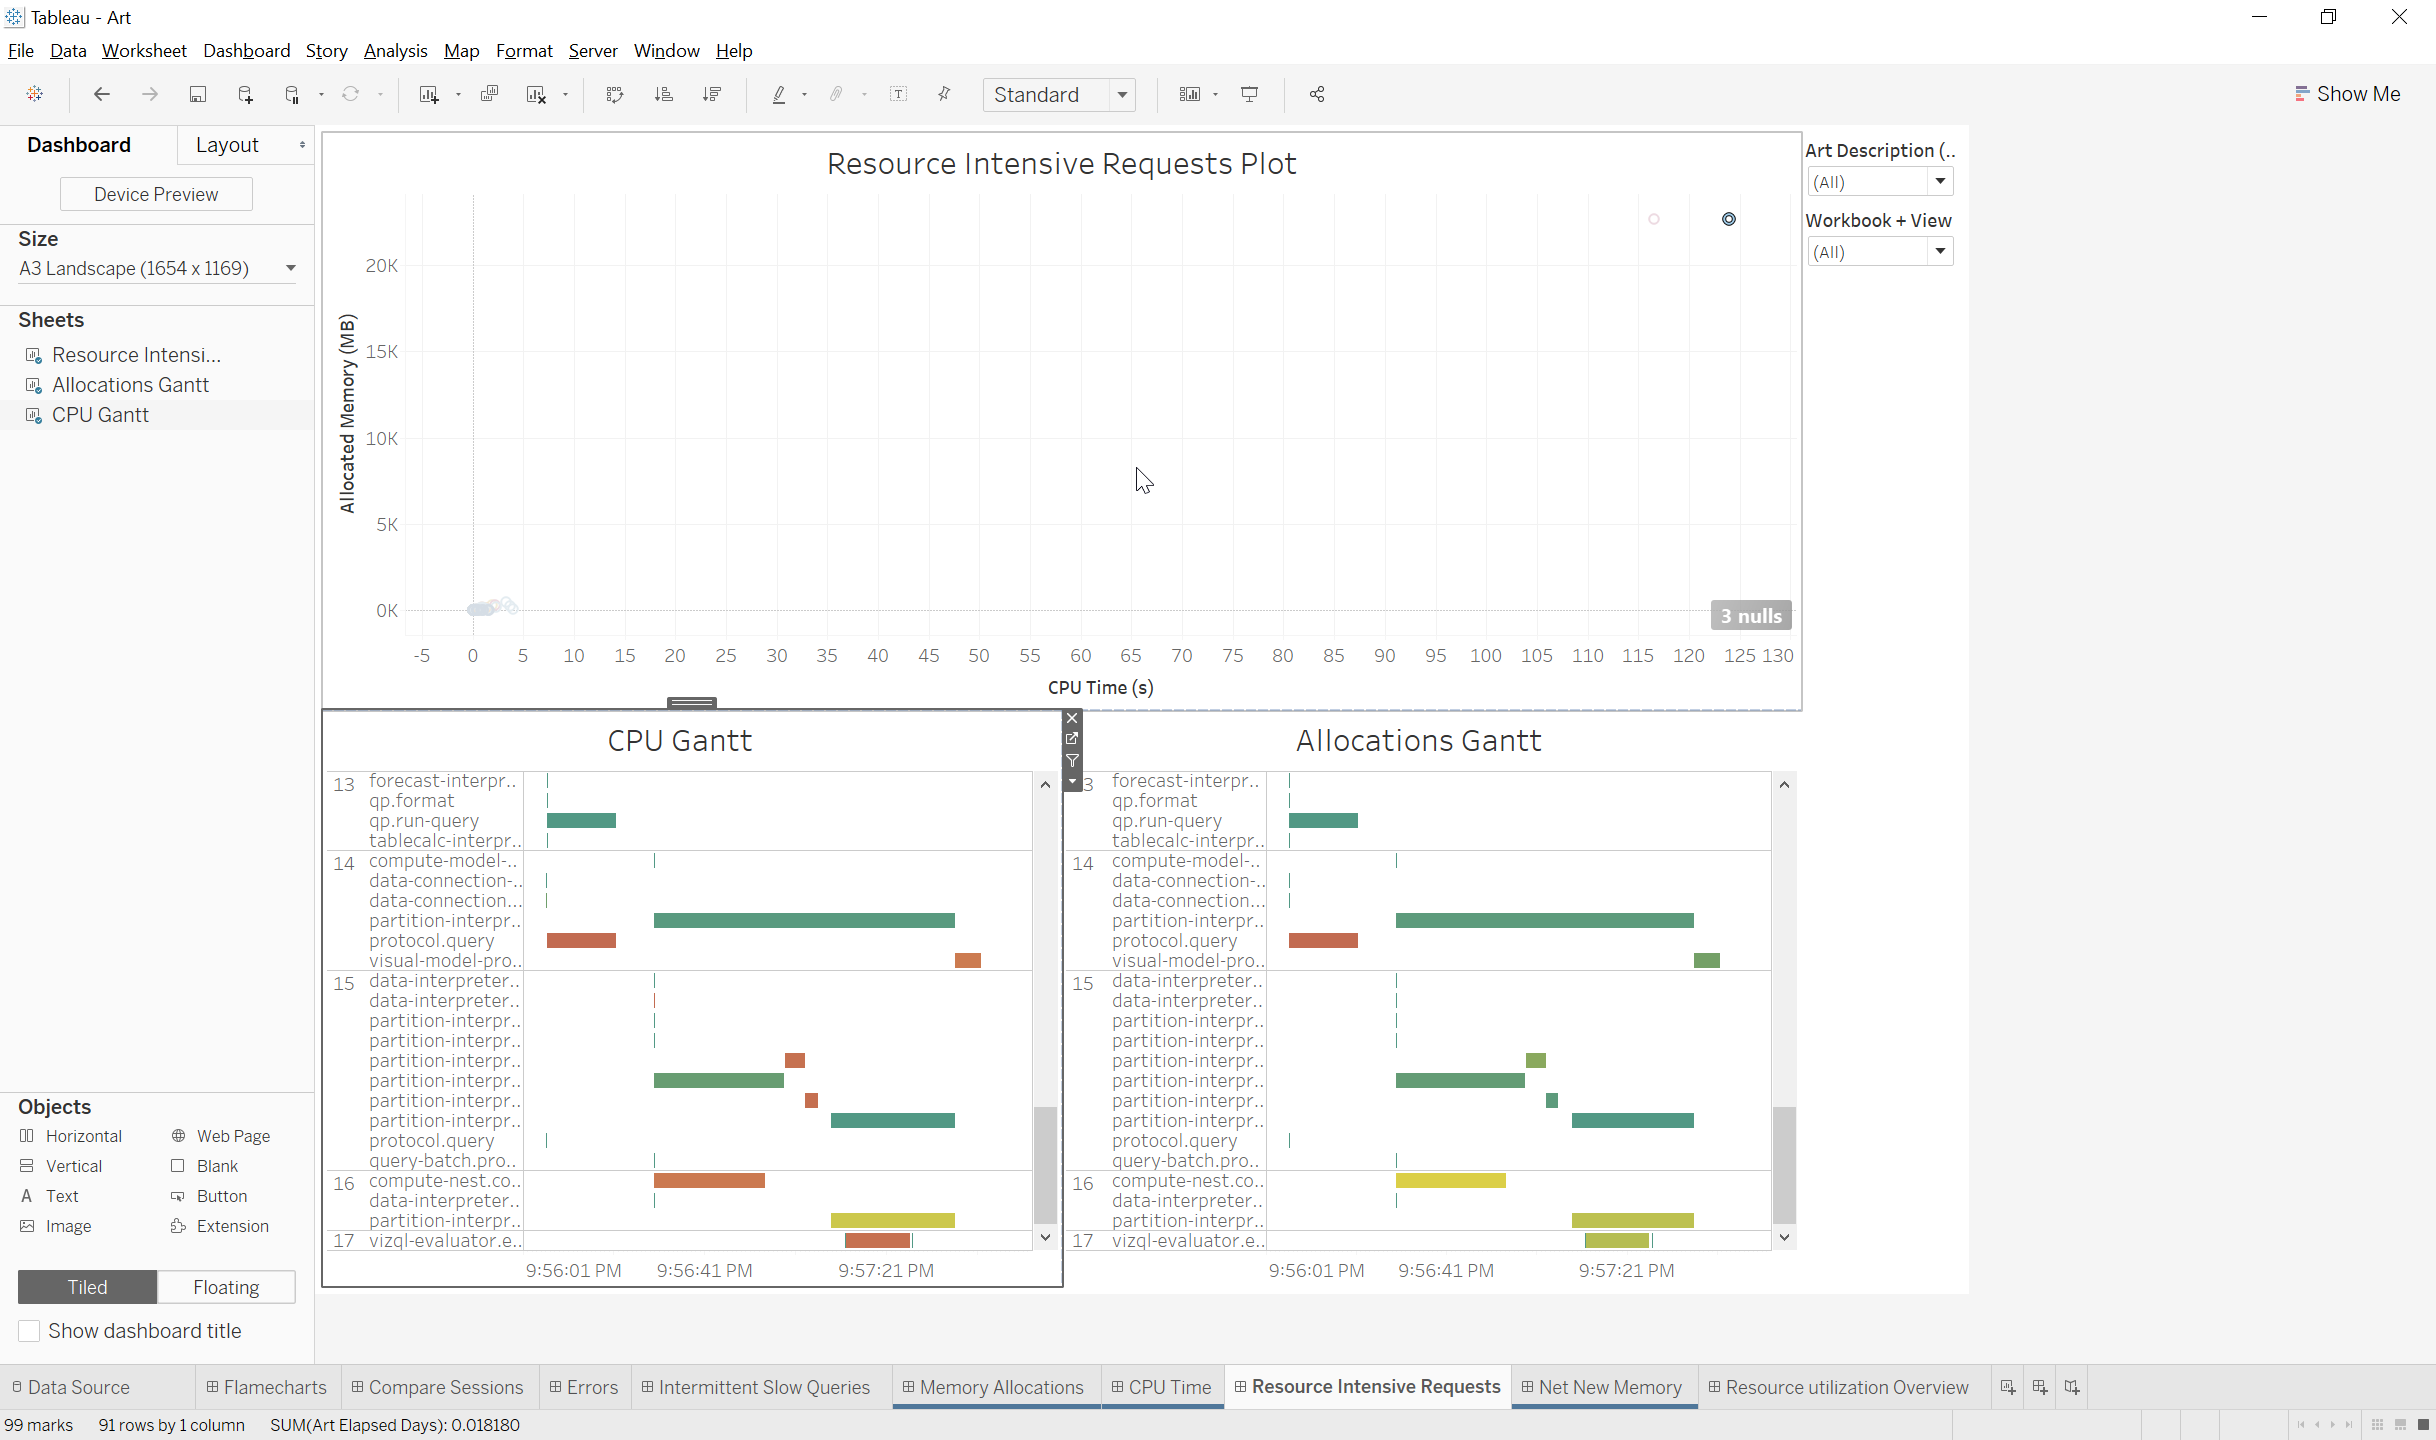
Resource Intensive Requests
Views:
- Resource Intensive Requests Plot: This view shows all requests on a plot graph with Inclusive CPU time on the X axis and Inclusive Allocated memory on the Y graph
- CPU Gantt: This sheet is a depth flame chart with Timestamp on the Column and ART Depth and Activity name on the rows
- Mark Size: Gantt bars sized based on elapsed time
- Mark Color: Gantt bars colored on Exclusive CPU utilization percentage for activity
- Allocations Gantt: This sheet is a depth flame chart with Timestamp on the Column and ART Depth and Activity name on the rows
- Mark Size: Gantt bars sized based on elapsed time
- Mark Color: Gantt bars colored on exclusive allocation bytes for the activity
Quick Filters:
- Art Description Dropdown: This dropdown filter defaults to show all requests but can be used to filter down to just initial load or specific interactions
- Workbooks+view Dropdown: Defaults to all but can be used to show only specific dashboards
Actions:
- Selecting a mark in the plot graph populates the gantt charts with the activities for the selected request
Notes:
- Not all expensive workbooks will have high CPU and Memory resource utilization. Some workbooks will be memory intensive and light on CPU and vice versa
Use Cases:
- This workbook is useful to identify the most resource intensive requests in the logset and then use the Gantt charts to narrow down to what components and activities were expensive for the request
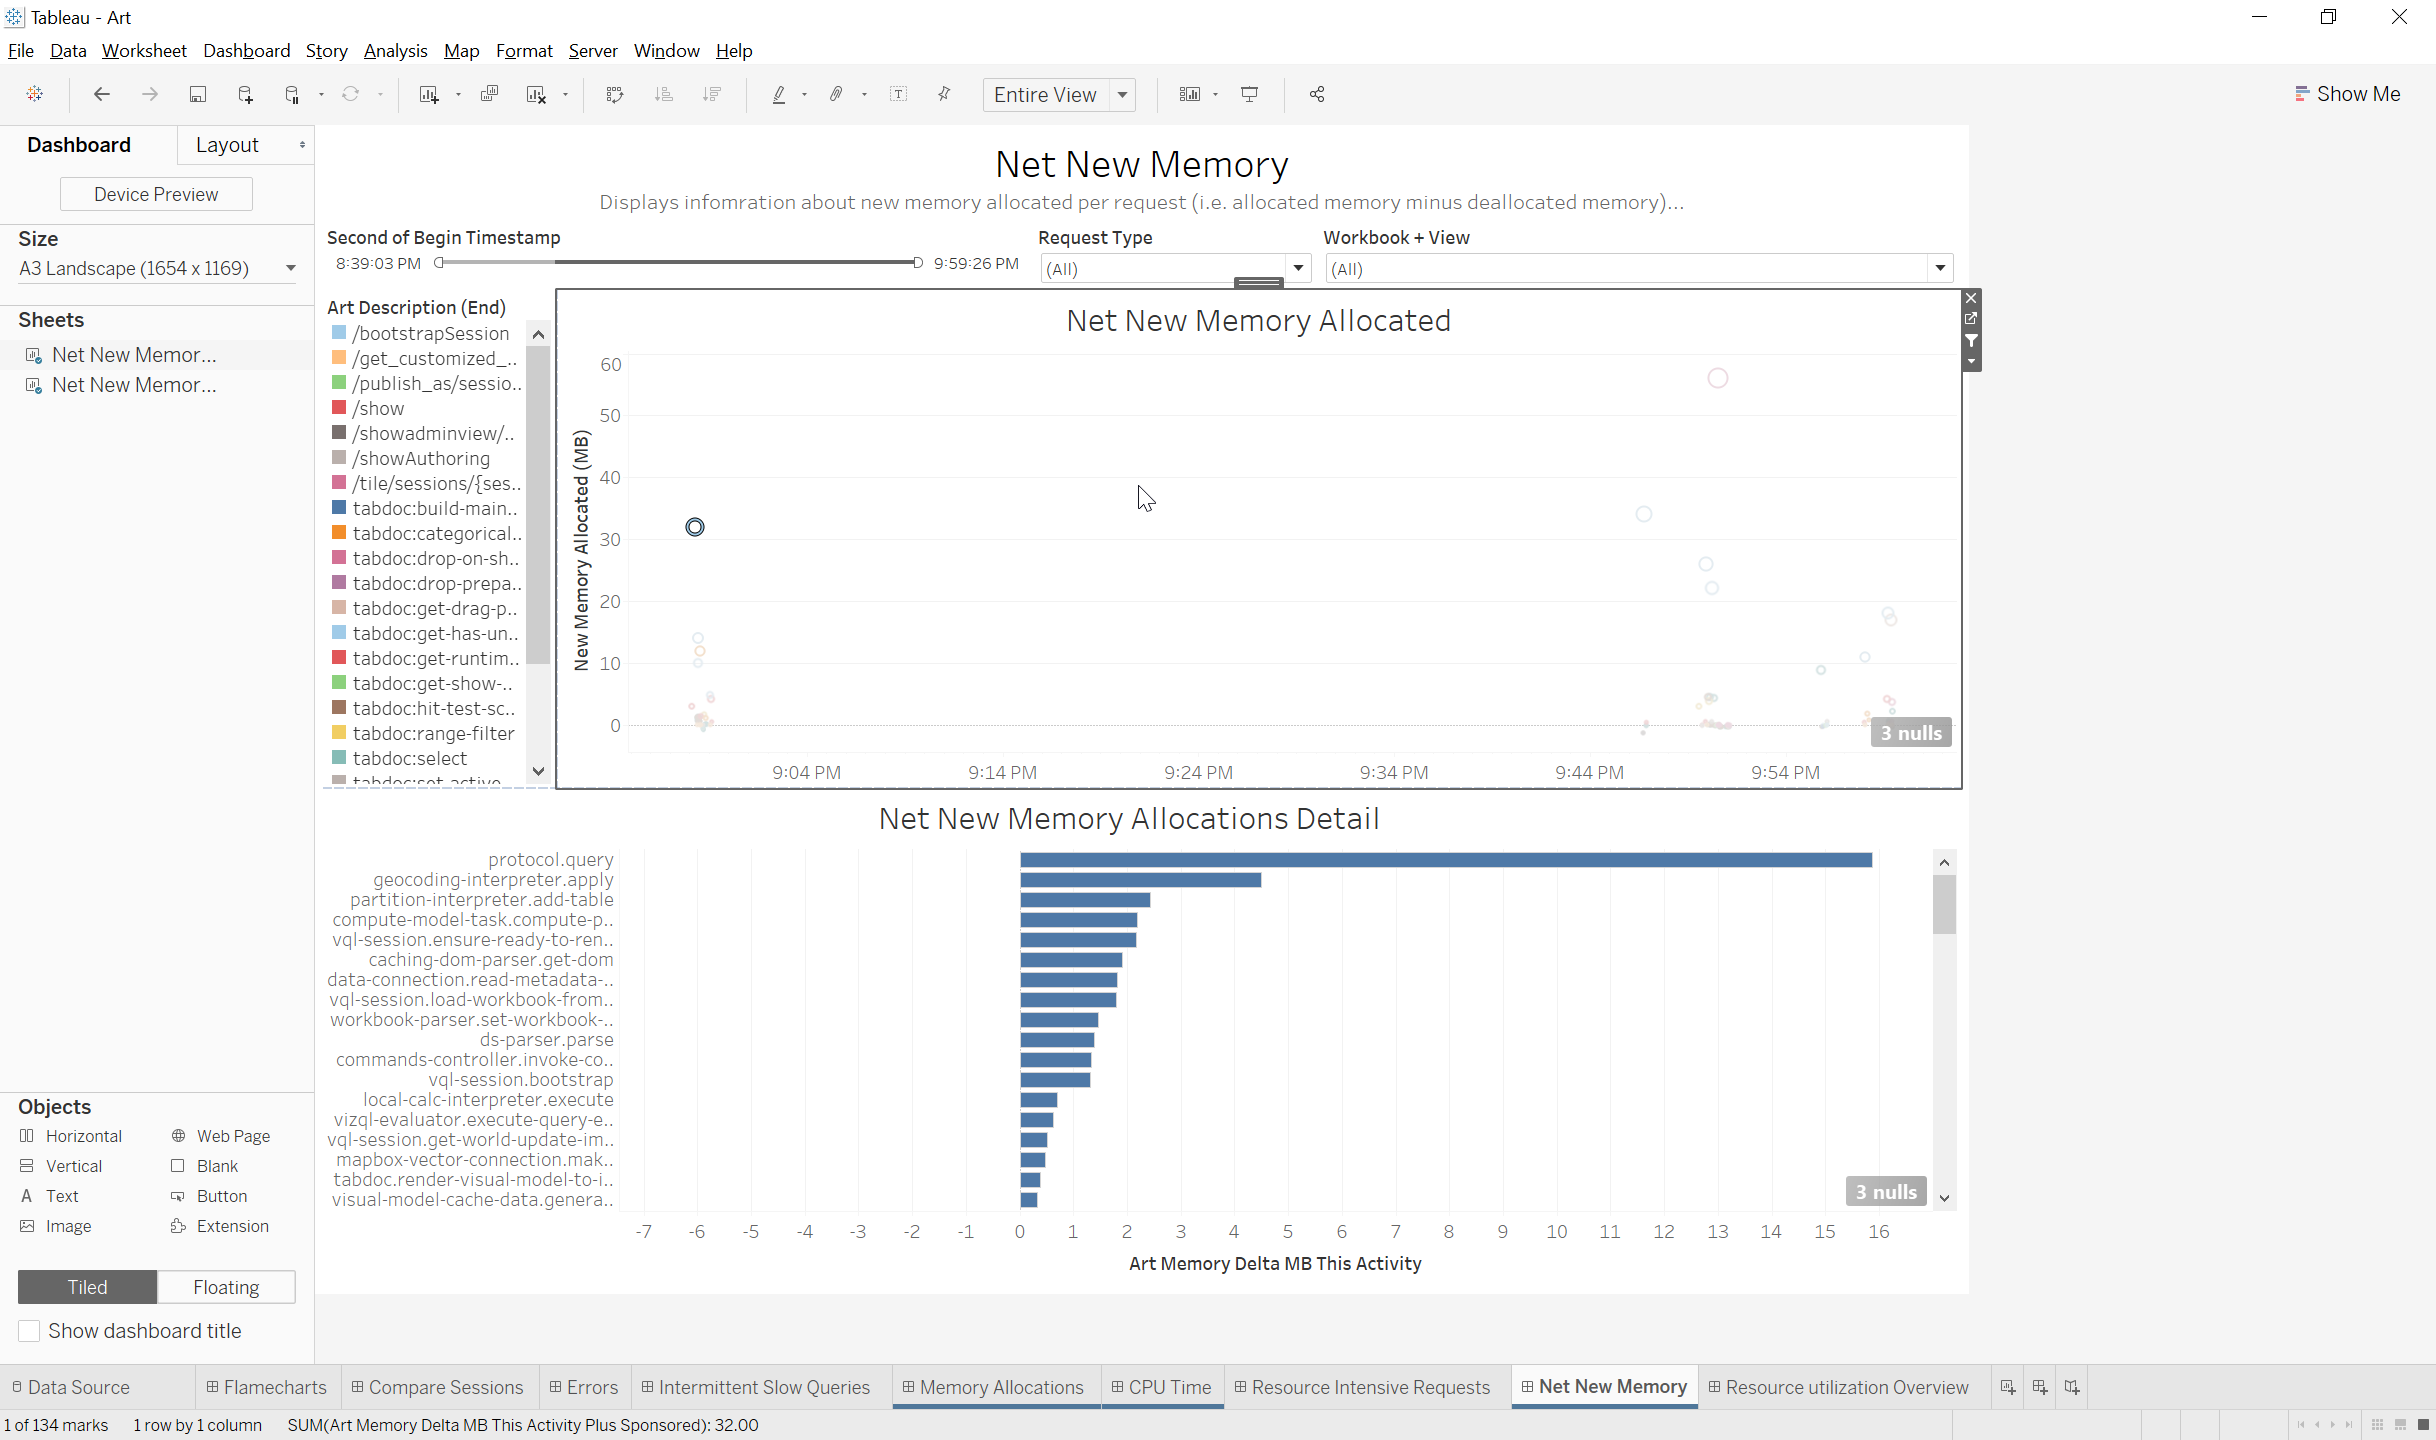
Net New Memory
Views:
- Net New Memory Allocated: This plot graph shows requests on a plot with Begin timestamp for the request on the X axis and New Memory Allocations(The remainder of memory allocated minus memory freed) on the Y axis
- Color: The marks are colored based on the Request Type
- Net New Memory Allocation Detail: This sheet shows the new memory allocations for each activity for the selected request
Quick Filters:
- Begin Timestamp Range Filter: This range filter can be used to narrow the plot graph to only show requests for a specific timeframe
- Request Type: Can be used to only show requests for a specific request type
- Workbook+view: Can be used to narrow down to requests for specific dashboards
Actions:
- Selecting a mark in the plot graph will populate the ‘Net New Memory ALlocation Detail’ with the memory allocation details for the selected request
Notes:
- This dashboard shows the memory that is allocated and not freed for requests and activities that are captured in the ziplog set but may show net new memory for sessions that had not yet been cleared from memory at the time the iplogs were captured
Use Cases:
- This dashboard can be useful to identify the cause of persistent memory usage issues that cause vizqlserver memory usage to increase with uptime. The Allocation Detail sheet is useful to identify which activities for the request were responsible for the majority of the net new memory
Resource Utilization Overview
Views:
- Sum of memory allocations by Request Type: Shows which types of requests were responsible for the most memory usage across the logset
- Percent Exclusive CPU Time by Activity: This view shows which activities were responsible for the most CPU usage across all requests in the logset
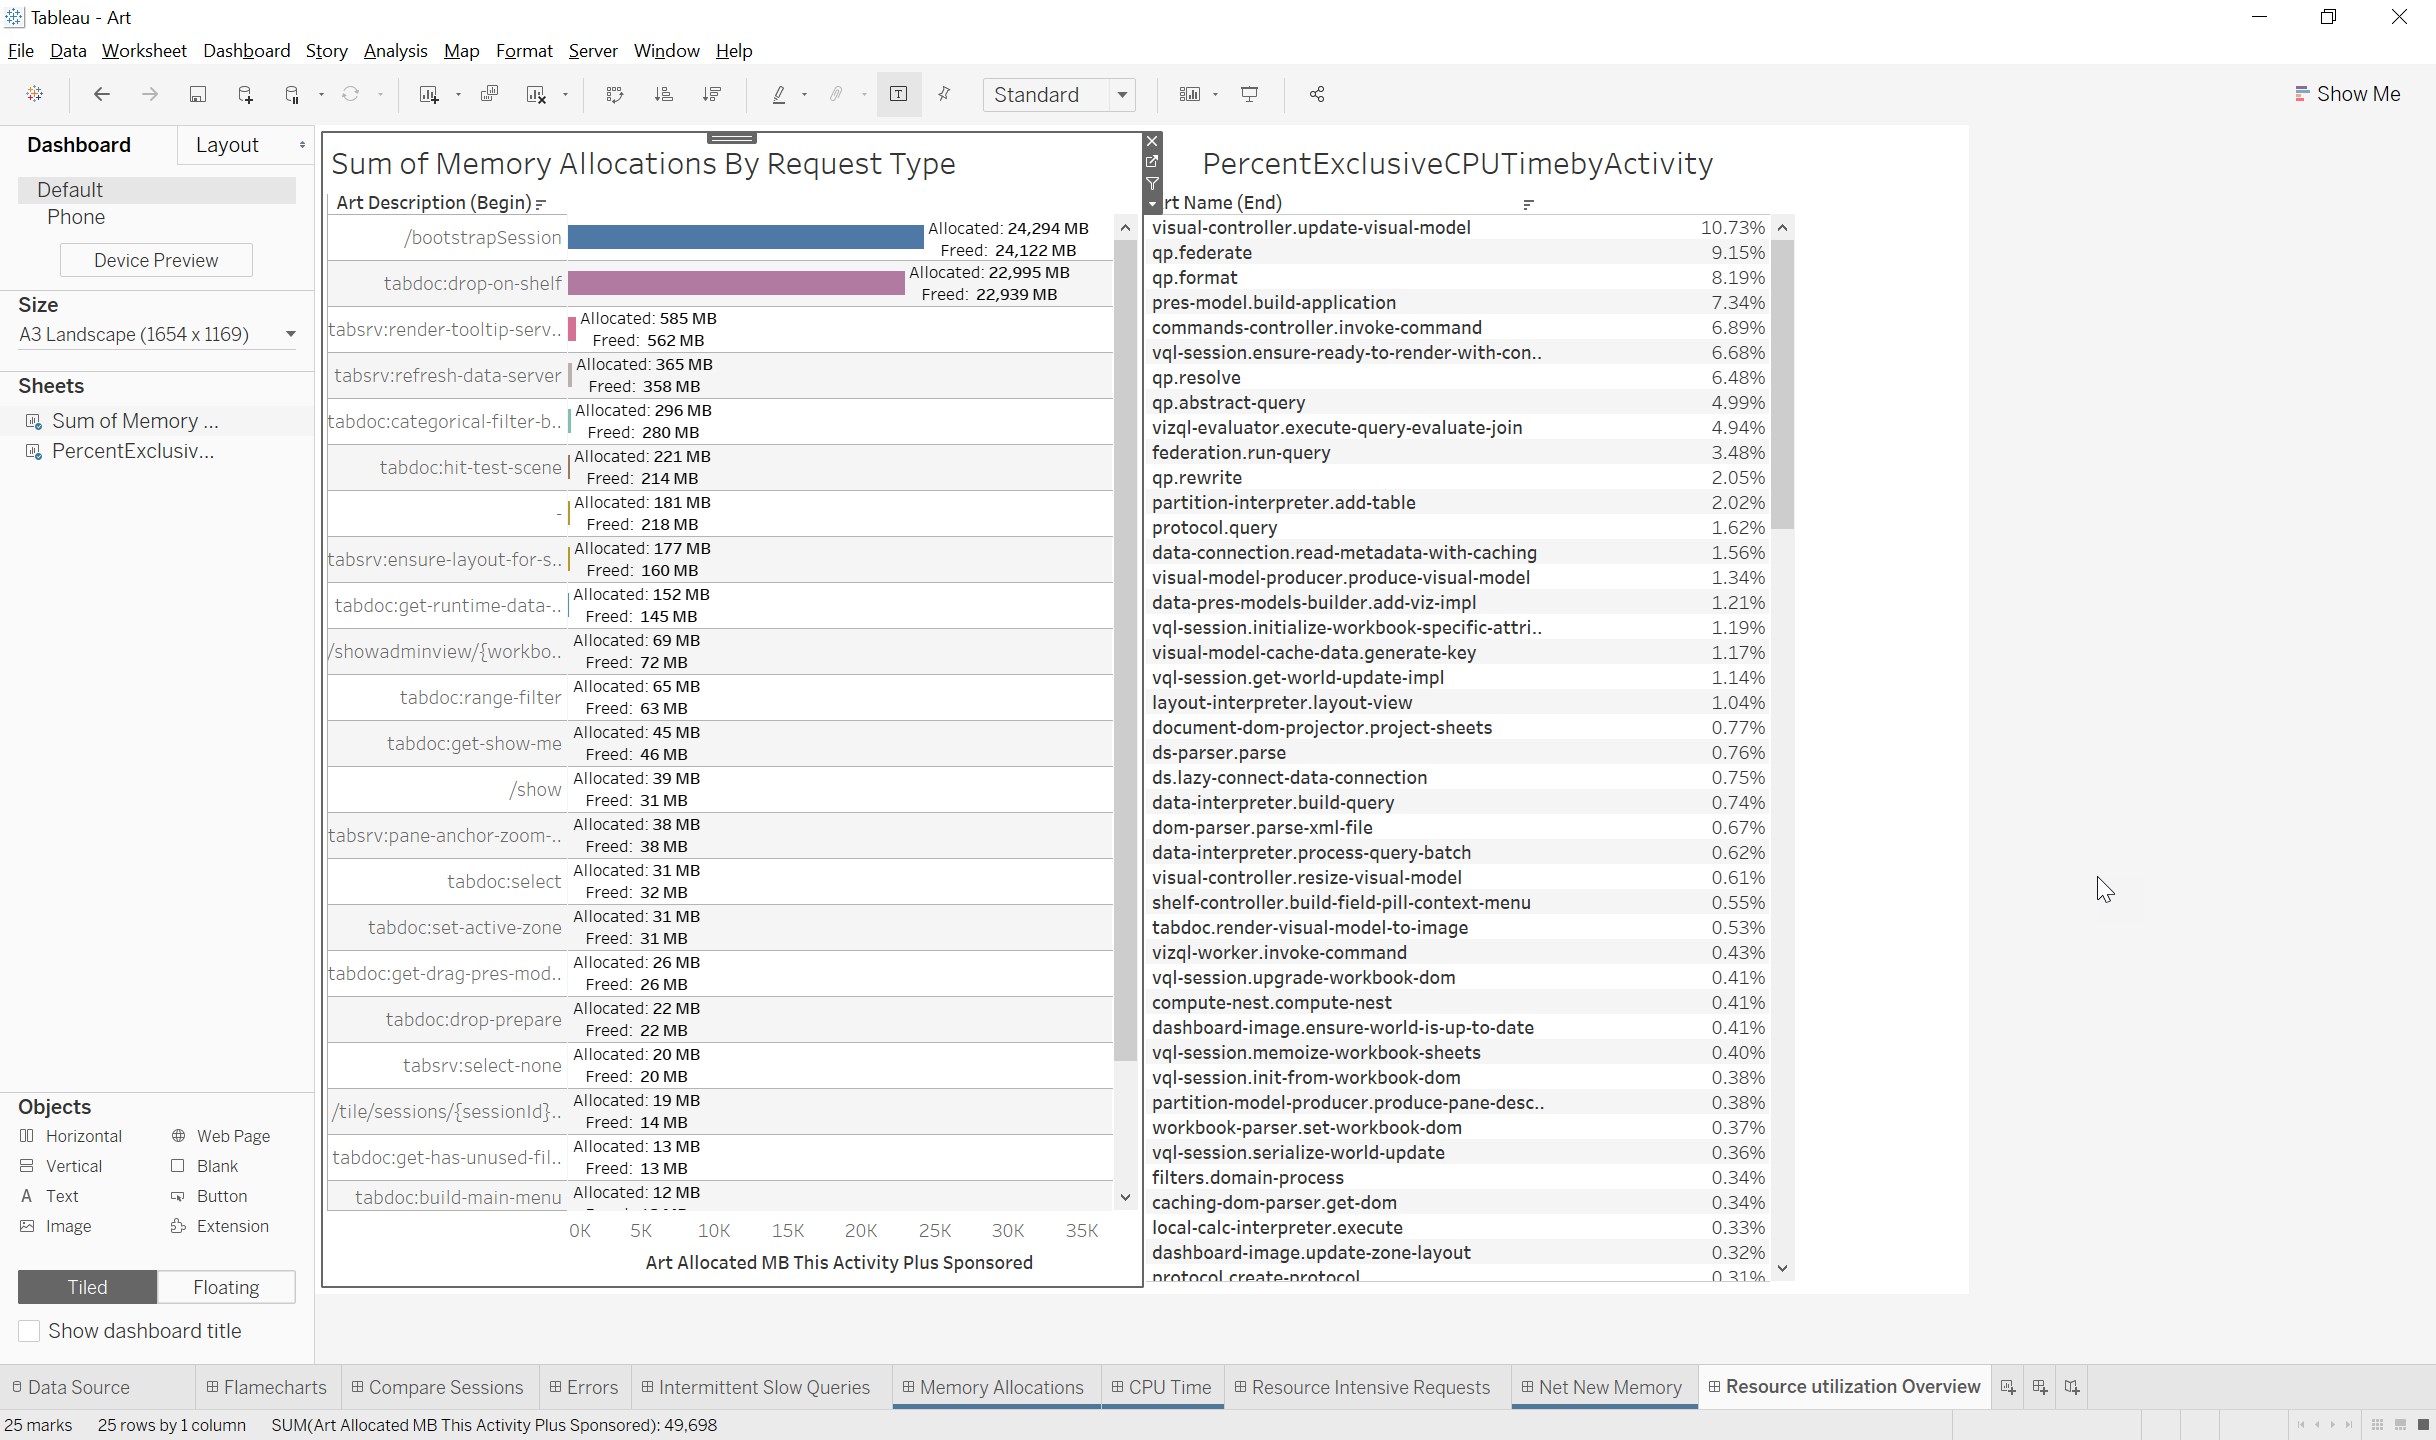
Use Cases:
- This dashboard is a high level overview of which requests and activities were responsible for the most CPU and memory usage. This dashboard is useful to identify any issues with certain request types or activities using more CPU//Memory than expected in the deployment
| ART Datasource Field Name | Log Name | Metric Description |
|---|---|---|
| ts | the timestamp when the event occurred (as opposed to when it was logged or emitted) | |
| process ID | the process id | |
| Thread ID | the Thread ID | |
| sev | log severity leve (error, warn, info, debug, trace) | |
| req | the request id. The meaning of request id will vary depending on the service. In vizqlserver it is the id assigned by apache tomcat to a /vizql request. All ART and log events that occur as part of a particular request will share the same request id. | |
| sess | the session id. The meaning of session id will vary depending on the service. In vizqlserver it is the vizql session id. In dataserver, it is the dataserver session id. Generally speaking, a session is long-lived and many requests can happen for the same session. | |
| site | the Tableau Server / Tableau Online site name. | |
| user | Tableau Server / Tableau Online user name | |
| k | event key. The event key specifies the event type. Some parts of a log event are optional. Whether or not these parts contain data – and what kind of data – is determined by the event type. In other words, the event key determines the event schema. For ART events, you can expect up to three different event keys for each kind of activity: the begin-activity event, the end-activity event, and the supp-activity event (for supplemental events). | |
| l | location information. Only appears in depth=0 ART end events.<ul><li>env: The value of the vizqlserver.ServerEnvironment option, if set.</li><li>host: The hostname.</li> | |
| depth | depth in the activity tree. In vizqlserver, the root activity is synonymous with the request and is at depth=0. If the root activity calls activity B and activity B calls activity C, B is at depth=1 and C is at depth=2. | |
| elapsed | present in end events only. The activity duration in seconds. | |
| id | the activity UUID. Each occurrence of an activity has a different UUID. The begin, end, and supplemental events for the occurrence of an activity share the same UUID. | |
| name | the activity name, which consists of a component name part, and one or more activity name parts. | |
| req-desc | the request description. Only present in depth=0 (request) activities. It is 1:1 with a user action in a client generating an HTTP request against the vizqlserver service. The value is more or less equivalent to the specific vizqlserver HTTP endpoint. | |
| Alloc | memory allocation metrics<ul><li>e: bytes allocated for this activity excluding all sponsored activities</li><li>i: bytes allocated for this activity including descendent (sponsored) activities</li><li>peak: Max (as in high water mark) bytes allocated at some point, for this activity</li><li>ne: number of times allocations occurred for this activity excluding all sponsored activities</li><li>ni: number of times allocations occurred for this activity including descendant (sponsored) activities</li></ul> | |
| Free | memory deallocation metrics<ul><li>e: bytes released for this activity excluding all sponsored activities</li><li>i: bytes released for this activity including descendent (sponsored) activities</li><li>ne: number of times release occurred for this activity excluding all sponsored activities</li><li>ni: number of times release occurred for this activity including descendent (sponsored) activities</li> | |
| KCPU | kernel space cpu metrics. Note: on Windows we do not separately report kernel cpu (it is combined with user cpu as a user cpu).<ul><li>e: kernel cpu thread time for this activity excluding descendent (sponsored) activities. Units are ms.</li><li>i: kernel cpu thread time for this activity including all sponsored activities. Units are ms</li></ul> | |
| NTID | number of threads the activity ran on | |
| UCPU | user space cpu metrics. Note: on Windows kernel and user cpu is combined and reported as user cpu.<ul><li>e: user cpu thread time for this activity excluding descendent (sponsored) activities. Units are ms.</li><li>i: user cpu thread time for this activity including all sponsored activities. Units are ms.</li></ul> | |
| RK | the result key, by default “ok”. | |
| RV | the result value: a dictionary of key-value pairs which provide more information about the result. | |
| Root | the UUID of the root activity. Not present on depth=0 activities. | |
| Sponsor | the UUID of the activity that caused this activity. | |
| Type | the type of activity event: begin, end, or supp (stands for supplemental). Begin and end are self-explanatory. Supplemental events are like regular log events except they are explicitly tied to a particular activity as identified by the activity UUID. | |
| CTX | context attributes.<ul><li>vw: the name of the view associated with the request. A view can be a dashboard, storyboard, or worksheet. Keep in mind that if the request operates on a dashboard, individual activities might operate on worksheets in that dashboard, but the vw will be the same for all activities in the request tree.</li><li>wb: the name of the workbook associated with the request.</li></ul> | |
| V | custom event attributes. This is a dictionary of key-value pairs. Which key-values are present depends on the event key (k). |