TabPy
Execute Python code on the fly and display results in Tableau visualizations:
Using Python in Tableau Calculations
Configuration
Once you have a TabPy instance set up you can easily configure Tableau to use this service for evaluating Python code.
Tableau Desktop
To configure Tableau Desktop version 10.1 or later to connect to TabPy server follow steps at Tableau Configure an Analytics Extension connection documentation page.
Tableau Server 2020.2 and Newer Versions
Starting from Tableau Server 2020.2 analytics extensions connections are configured on site level as shown of Configure Connections to Analytics Extensions page.
Tableau Server 2020.1 and older
For older Tableau Server versions refer to version specific documentation:
Tableau Server 2018.2 and 2018.3
To configure Tableau Server 2018.2 and newer versions to connect to TabPy server follow instructions on Tableau Configure Connections to Analytics Extensions page.
Specific details about how to configure a secure connection to TabPy, enable or disable connections and other setting can be found at Tableau TSM Security documentation page.
For how to configure TabPy instance follow instructions at TabPy Server Config documentation.
Tableau Server 2018.1 and Older Versions
For Tableau workbooks with embedded Python code to work on Tableau Server 10.1
or later, you need to go through a similar setup but using the
tabadmin
command line utility. The two server settings that need to be configured are
vizqlserver.extsvc.host and vizqlserver.extsvc.port.
tabadmin stop
tabadmin set vizqlserver.extsvc.host <ip address or host name for TabPy>
tabadmin set vizqlserver.extsvc.port <port for TabPy>
tabadmin configure
tabadmin start
Note that you cannot use TabPy secure connection with 2018.1 and older versions of Tableau.
Note that it is not necessary to install TabPy on the Tableau Server or Desktop computer-all that is required is a pointer to a TabPy server instance.
Once you’re done with configuration, you can use Python in calculated fields in Tableau.
Anatomy of a Python Calculation
Tableau can pass code to TabPy through four different functions: SCRIPT_INT, SCRIPT_REAL, SCRIPT_STR and SCRIPT_BOOL to accommodate the different return types. In the example below you can see a simple function that passes a column of book names (highlighted in blue) to Python for proper casing. Since Python returns an array of string, SCRIPT_STR function is used.
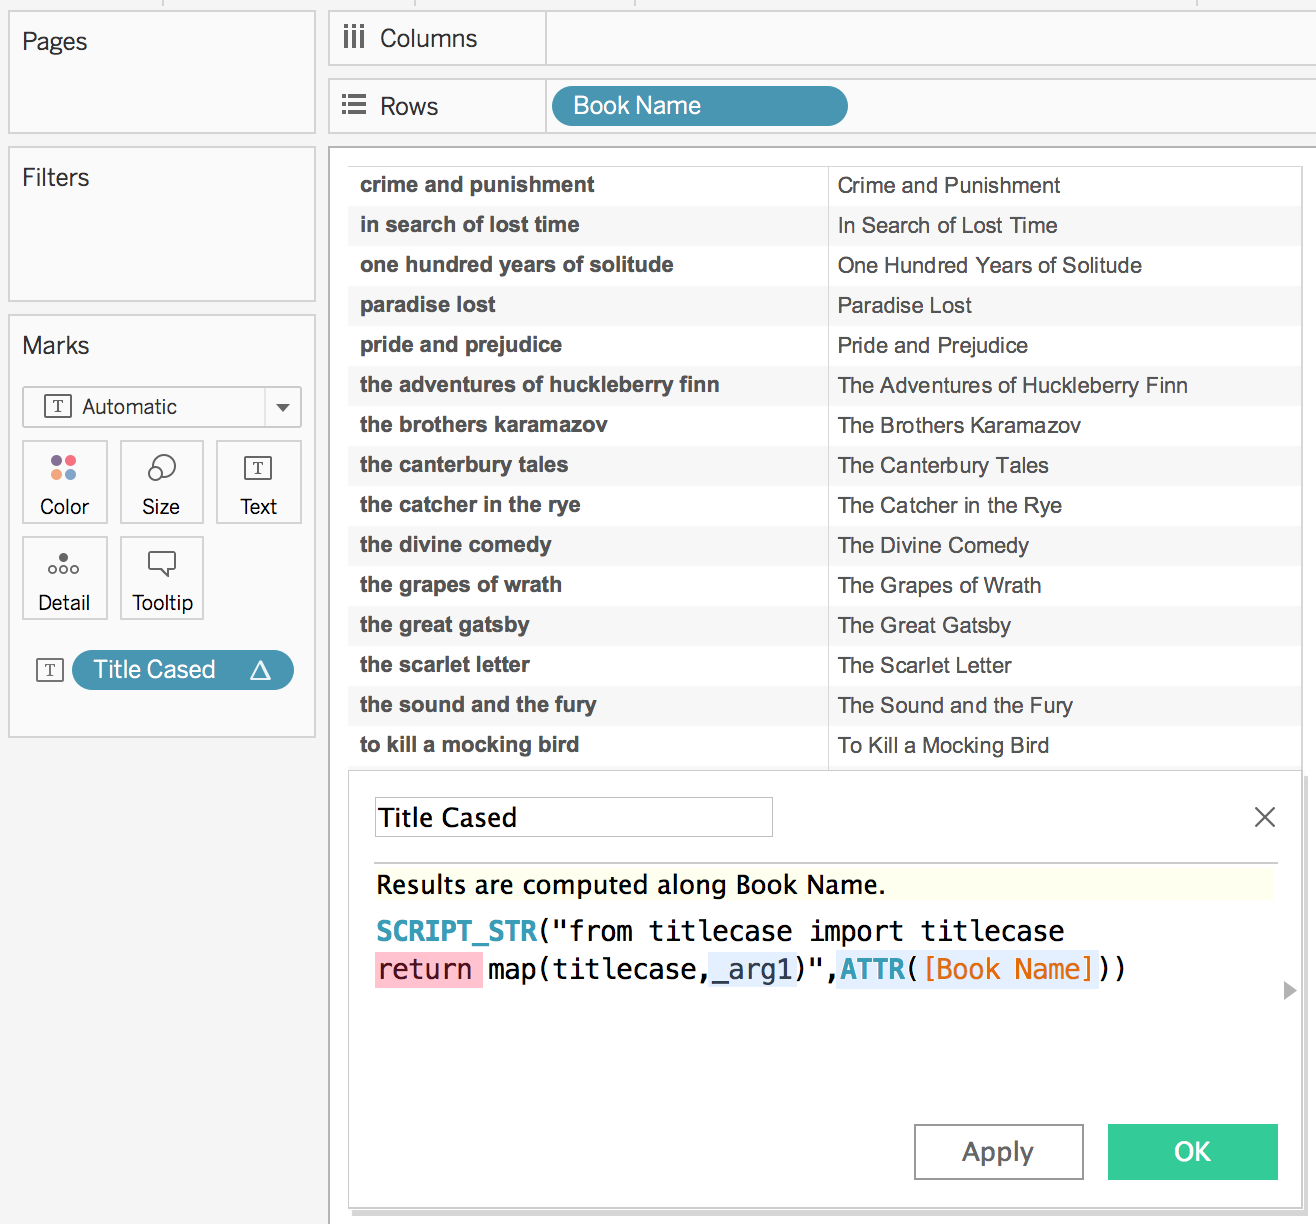
For a SCRIPT call to Python to be successful, it needs to return a result
explicitly specified with the return keyword (highlighted in red).
In this simple example, there is only one input but you can pass as many arguments to SCRIPT functions as you like. Tableau takes the arguments in the order provided and replaces the _argN placeholders accordingly. In this case ATTR([Book Name]) maps to _arg1 and both are highlighted to indicate the association.
Tableau expects the SCRIPT to return a single column that has either a single row or the same number of rows as it passed to TabPy. The example above sends 18 rows of data to TabPy and receives 18 rows back.
In the example below Tableau passes multiple columns to TabPy and gets a single
value (correlation coefficient) back. SUM(Sales) and SUM(Profit) are used as
argument 1 and 2 respectively and highlighted in matching colors.
In this case the function corrcoef returns a matrix from which the correlation
coefficient is extracted such that a single column is returned.
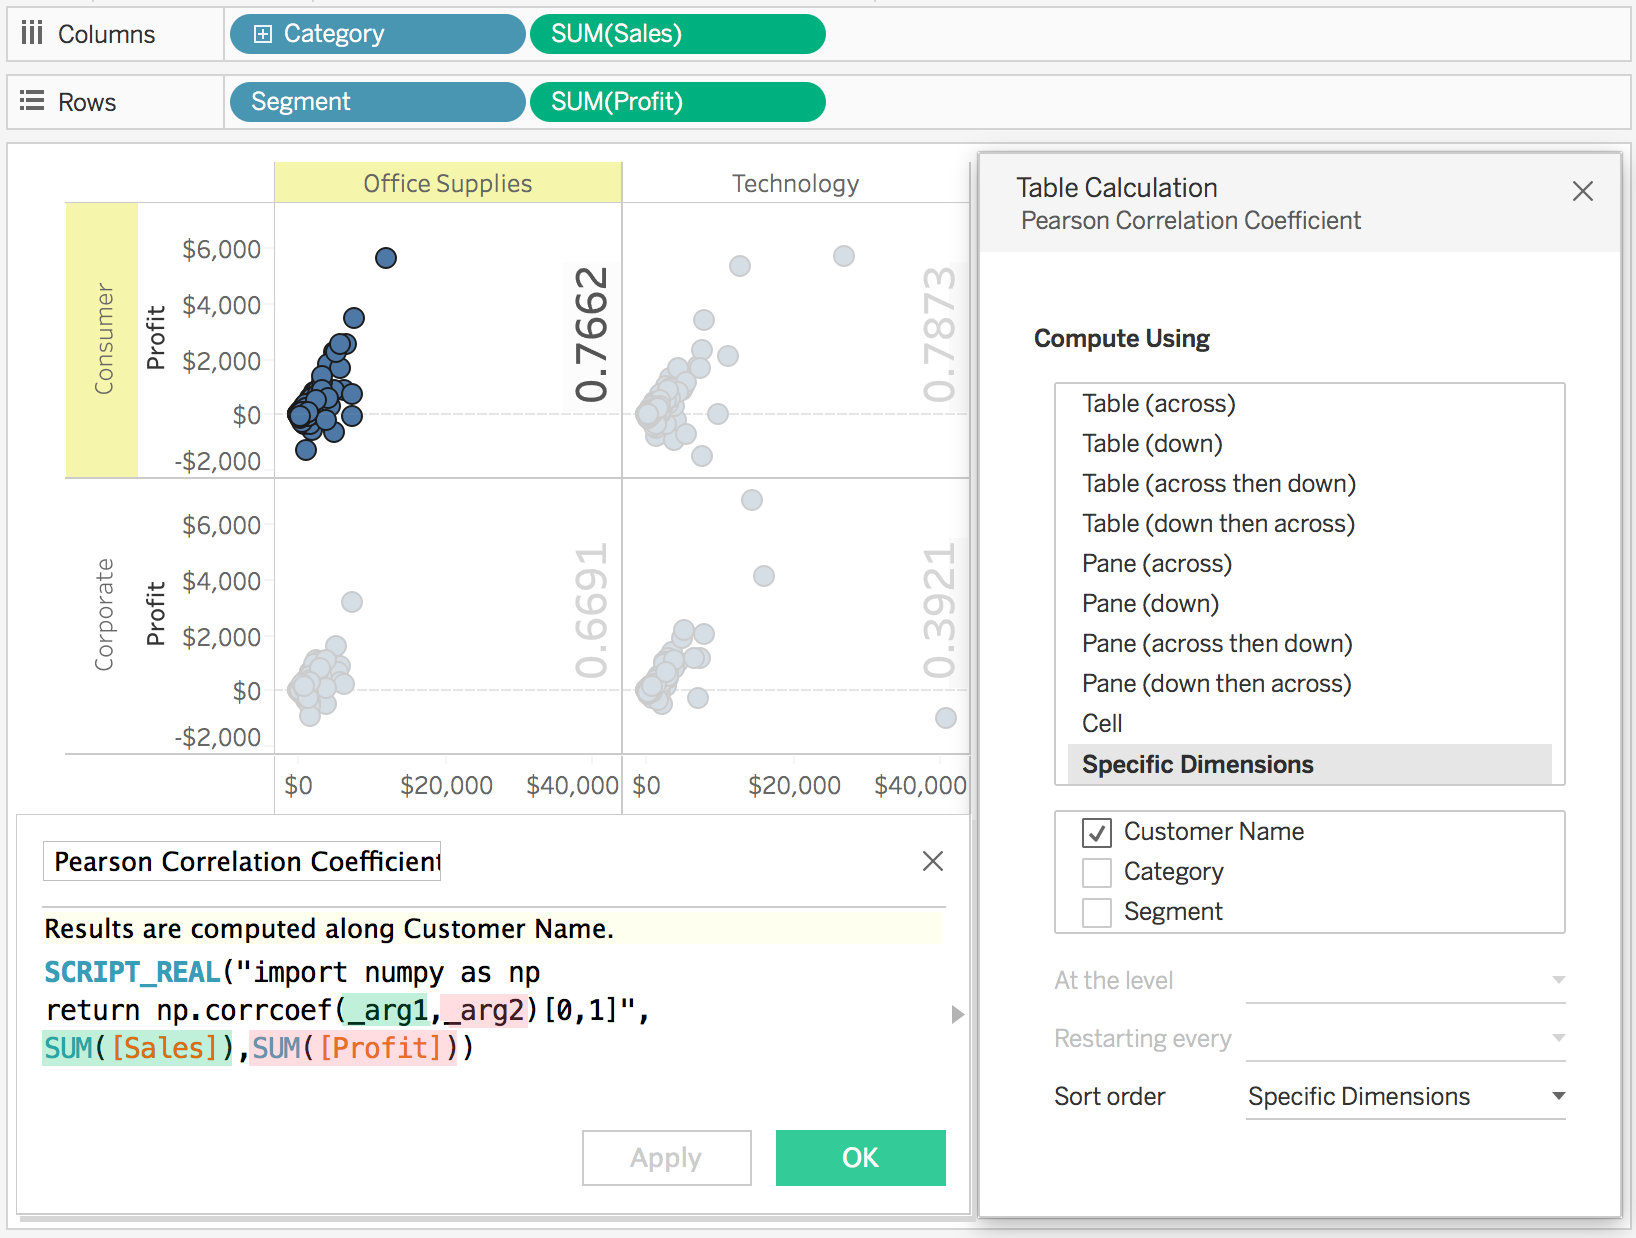
Tableau aggregates the data before sending to TabPy using the level of detail of the view. In this particular example each point in the scatter plot is a Customer and TabPy is receiving SUM(Sales) and SUM(Profit) for each Customer.
If you would like to run your Python code on disaggregate data, you can achieve this simply by unchecking the Aggregate Measures option under the Analysis menu.
The example above showcases another capability that can come in handy if you like to run the same Python script multiple times in different contexts. In this particular example, unchecking the Category and Segment boxes in the Table Calculation dialog results in Tableau making multiple calls to TabPy, once per each pane in the visualization. Running regression analysis independently for each Segment-Category combination.
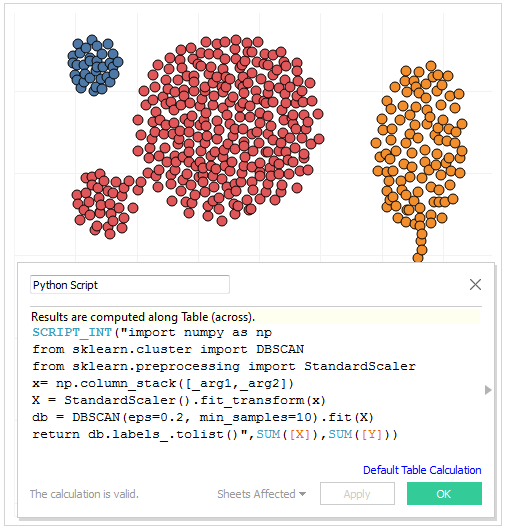
In all of these examples the data structure being returned by the function can be consumed by Tableau. This may not always be the case. If your Python code returns a one dimensional array but TabPy is failing to serialize it to JSON, you may want to convert it to a list as shown in the example below.
You can find two detailed working examples with downloadable sample Tableau workbooks on our blog.
Using Deployed Functions
TabPy Tools documentation covers in detail how functions
could be deployed as endpoints.
You can invoke such endpoints using tabpy.query option by specifying the
endpoint name and arguments and retrieving the response object.
A SCRIPT calculated field in Tableau using the add endpoint defined in TabPy Tools documentation could look like the following:
SCRIPT_REAL("
return tabpy.query('add',_arg1,_arg2)['response']",
-SUM([Discount]),SUM([Price]))
You can find a detailed working example with a downloadable sample Tableau workbook showing how to publish models and use the published models in calculated fields on our blog.