Get Data - Best Practices
Important: Tableau Web Data Connector 2.0 (this version) is being deprecated at Tableau 2023.1 and eventually retired. We will still support WDC 2.0 until its last compatible version of Tableau (Tableau 2022.4) goes End of Life and is no longer supported.
For information about Tableau Web Data Connector 3.0, see the WDC 3.0 documentation.
In the WDC Gather Data Phase, it’s a best practice to insert data into the extract you create in manageable amounts. This is often called data chunking or paging and it can help improve performance and can keep the WDC from overloading Tableau, and can provide a better experience for end-users because they can see regular progress indicators. This best practice is important when you are working with very large data sets.
This topic describes an approach that could be used to add data in chunks during the WDC Gather Data Phase.
In this section:
- Append rows in the WDC Gather Data Phase
- Determine how to split your data
- Use the reportProgress function to log your commits
- Example code: EarthquakeUSGS
Append rows in the WDC Gather Data Phase
You might recall from the WDC lifecyle diagram shown in WDC Lifecyle and Phases, the WDC Gather Data Phase includes the call to getData, which is called once for each schema (or table). Within that getData function call, you can call table.appendRows as many times as you need to append data to the table that is created. The appendRows function allows you to insert your data in manageable chunks.
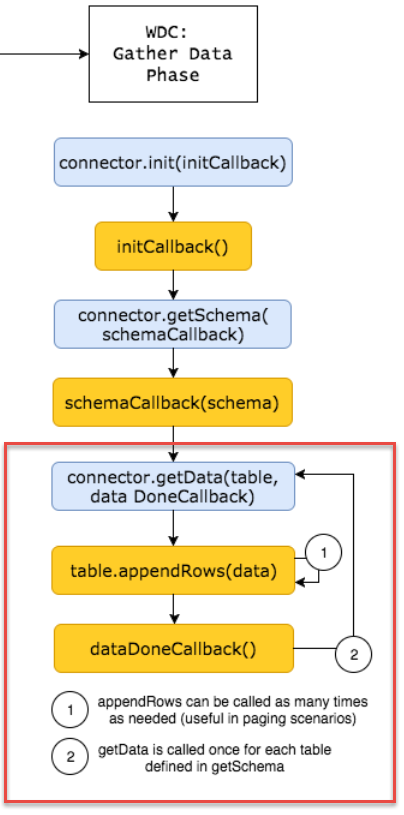
The diagram legend is as follows.
Determine how to split your data
How you determine the amount of data to append at a time depends upon the overall size of your data. If your data is very large (over 128MB, for example), you will need to break it down in to smaller chunks. If you data set is small, you might not need to chunk it at all.
The appendRows function has one parameter, which can be an array of arrays or an array of objects. A common way to split the data is by having the same number of rows in each chunk. Some rows may be larger in size than others, so you may have to iterate to find an appropriate number of rows.
The following appendRows example shows how you might create a size variable and use that with a row count variable to iterate through the data. Rather than building the extract all at once with the call to table.appendRows, the WDC uses a while loop to call the appendRows function iteratively based upon the row index and the size we chose to increment. In this example, we use a size variable that is an arbitrary integer that determines how much of the data to append. It represents the number of items in the array to add at one time. In this example, we use the JavaScript slice function to split the tableData array into smaller chunks. The size we use is 100, so 100 rows from the tableData array are added to the extract at a time. For large data sets, you would probably want to use a larger value to improve the performance. Be sure to use a size value that keeps amount of data added in each appendRows call under 128MB.
    //  called inside the getData function
    //  after we populate the tableData

       var row_index = 0;
       var size = 100;
       while (row_index < tableData.length){
            table.appendRows(tableData.slice(row_index, size + row_index));
            row_index += size;
            tableau.reportProgress("Getting row: " + row_index);
        }
Use the reportProgress function to log your commits
The appendRows example also makes use of the reportProgress function. This function allows you to follow the progress of the Gather Data phase in Tableau. It is a best practice to call this function as you add your data to the extract.
reportProgress function is intended to inform Tableau Desktop users. Tableau Server users will not see the message, and calling the reportProgress function with a very high frequency could adversely affect performance. Note also that calling console.log or tableau.log in a similar manner with very high frequency could also affect performance.
tableau.reportProgress("Getting row: " + row_index);
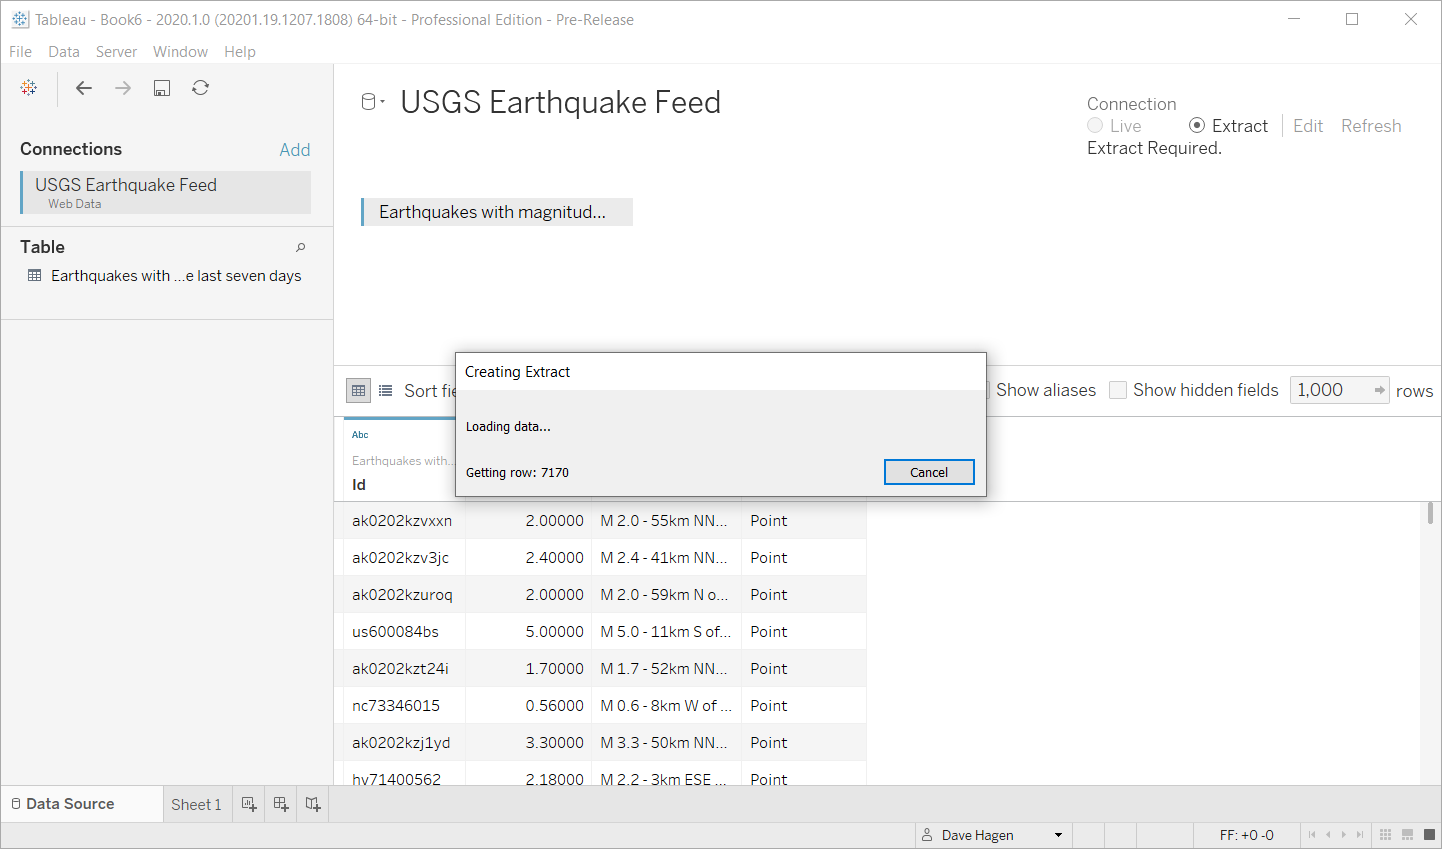
The progress is displayed in Tableau. For example, when you first load your WDC you are taken to the Data Source pane. When you click the Sheet 1 tab for the first time, the worksheet opens and the Create Extract dialog box appears and reports the progress. This can be helpful when you are loading a very large data set. With a small data set, the extract creation process goes quickly, so you might not see the progress dialog if the size increment you use is large.
Example code: EarthquakeUSGS
The following example is based upon the Tutorial and the EarthquakeUSGS sample. It is a slightly modified version of the earthquakeUSGS.js file you created in the tutorial. In this case, rather than building the extract all at once with the call to table.appendRows, the WDC uses a while loop to call the appendRows function iteratively based upon the row index and the size we chose to increment. The example also looks at a larger data set, in this case all the earthquakes (of any size) reported in the last month.
In this example, we create a function called chunkData that is a wrapper for the while loop we used in the previous example. Our chunkData function is called from the WDC getData function. You could create a function similar to this in your own WDC. Our chunkData function takes table and tableData as arguments. In our function, we use a size variable, which is an arbitrary integer value that we use to determine how much of the data we want to append. The data set we are using isn’t very large (less than 8MB). In this case, we chose 100 but you might need to use a larger value in your own function for better performance. Progress is reported as each row is added.
(function() {
    // Create the connector object
    var myConnector = tableau.makeConnector();

    // Define the schema
    myConnector.getSchema = function(schemaCallback) {
        var cols = [{
            id: "id",
            dataType: tableau.dataTypeEnum.string
        }, {
            id: "mag",
            alias: "magnitude",
            dataType: tableau.dataTypeEnum.float
        }, {
            id: "title",
            alias: "title",
            dataType: tableau.dataTypeEnum.string
        }, {
            id: "location",
            dataType: tableau.dataTypeEnum.geometry
        }];

        var tableSchema = {
            id: "earthquakeFeed",
            alias: "All earthquakes in the last 30 days",
            columns: cols
        };

        schemaCallback([tableSchema]);
    };

    // Download the data
    myConnector.getData = function(table, doneCallback) {
        $.getJSON("https://earthquake.usgs.gov/earthquakes/feed/v1.0/summary/all_month.geojson", function(resp) {
            var feat = resp.features,
                tableData = [];

            // Iterate over the JSON object
            for (var i = 0, len = feat.length; i < len; i++) {
                tableData.push({
                    "id": feat[i].id,
                    "mag": feat[i].properties.mag,
                    "title": feat[i].properties.title,
                    "location": feat[i].geometry
                });
            }
            // add the data
            chunkData(table, tableData);
            doneCallback();
        });
    };

    // add the data in manageable chunks
    function chunkData(table, tableData){
       var row_index = 0;
       var size = 100;
       while (row_index < tableData.length){
            table.appendRows(tableData.slice(row_index, size + row_index));
            row_index += size;
            tableau.reportProgress("Getting row: " + row_index);
        }
    }

    tableau.registerConnector(myConnector);

     // Create event listeners for when the user submits the form
    $(document).ready(function() {
        $("#submitButton").click(function() {
            tableau.connectionName = "USGS Earthquake Feed"; // This will be the data source name in Tableau
            tableau.submit(); // This sends the connector object to Tableau
        });
    });
})();